Customizing X–Y plot axis tick marks | |||||
|
| ||||
Context:
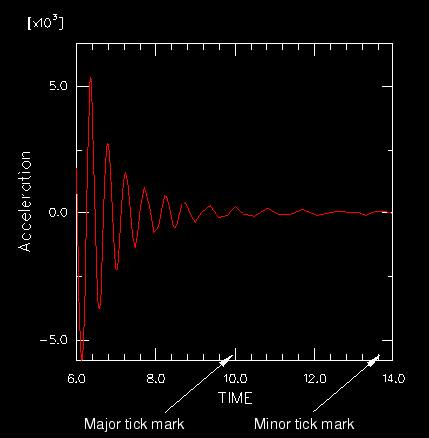
Click the Tick Marks tab to control the length, thickness, style, and color of major and minor tick marks that appear along the X- and Y-axes of an X–Y plot. The number of major and minor tick marks is controlled separately; see Customizing the X–Y plot axis tick mode. You can control the X- and Y-axis tick marks independently. Examples of major and minor tick marks are shown in Figure 1.

Major tick marks govern the placement of the X–Y plot major grid and the numeric axis labels. Minor tick marks are shorter, unlabeled marks governing the placement of the minor gridlines.
By default, Abaqus/CAE automatically computes the number of tick marks. You can specify major tick marks by giving the increment between them or the total number of tick marks. You can specify minor tick marks only by giving the total number between each major tick mark.
The color of the tick marks is governed by the color of the axes. For more information, see Customizing the X–Y plot axis color and style.
 , which is located with the
  .
.