Customizing the X–Y plot axis labels | ||||||
|
| |||||
Context:
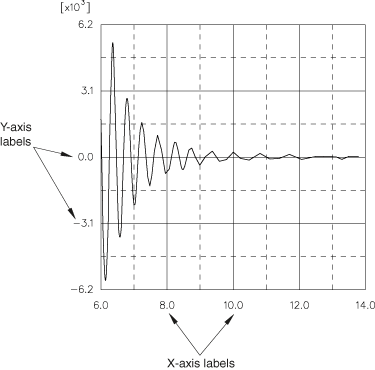
Click the Axes tab to customize the numeric labels that appear with the major tick marks along the X- and Y-axes of an X–Y plot. Examples of axis labels appear in Figure 1.

You can customize the following:
-
The format of the labels (automatic, decimal, engineering, or scientific).
-
The number of decimal places or significant digits in the labels.
-
The frequency of the labels in relation to the major tick marks.
-
The font of the labels.
The color of the labels is governed by the color of the axes. See Customizing the X–Y plot axis color and style, for more information.
 , which is located with the
  .
.
 .
.