Material Behavior
Elastomeric materials exhibit highly nonlinear mechanical behavior, which is often described using a combination of hyperelastic and viscoelastic materials. However, filled rubber exhibits additional softening behaviors that cannot be captured accurately by these models. For example, when a rubber specimen is loaded, unloaded, and then reloaded, the load required to produce a given stretch during reloading is smaller than that required to produce the same stretch during the primary loading phase. This behavior is known as Mullins effect. Another type of softening behavior commonly observed in rubber, particularly filled rubber, is amplitude-dependent softening under cyclic loading. Modeling the amplitude-dependent softening allows you to accurately predict the decrease of storage modulus with increased dynamic strain, a phenomenon that is known as Payne or Fletcher-Gent effect.
Abaqus provides functionality that can capture both types of softening behavior. The Ogden-Roxburgh model is particularly suitable for modeling the Mullins effect phenomenon, whereas the dynamic stiffness decrease can be predicted using the models with the exponential and slow decay forms of evolution of the damage variables. These models can also be effective at modeling material damage in a more general sense. Finally, you can also define other forms of the damage or softening behavior with dedicated user subroutines (UMULLINS and VUMULLINS). The different models are presented in detail in the following sections.
Ogden-Roxburgh Model of Mullins Effect
The real behavior of filled rubber elastomers under cyclic loading conditions is quite complex. Certain idealizations have been made for modeling purposes. In particular, the Ogden-Roxburgh model assumes two main components to the material behavior: the first component describes the response of a material point (from an undeformed state) under monotonic straining, and the second component is associated with damage and describes the unloading-reloading behavior.
Idealized Material Behavior
When an elastomeric test specimen is subjected to simple tension from its virgin state, unloaded, and then reloaded, the stress required on reloading is less than that on the initial loading for stretches up to the maximum stretch achieved during the initial loading. This stress softening phenomenon is known as the Mullins effect and reflects damage incurred during previous loading. This type of material response is depicted qualitatively in Figure 1.

This figure and the accompanying description are based on work by Ogden and Roxburgh (1999), which forms the basis of the model implemented in Abaqus. Consider the primary loading path of a previously unstressed material, with loading to an arbitrary point .
- Upon unloading from , the path is followed.
- When the material is loaded again, the softened path is retraced as .
- If further loading is subsequently applied, the path is followed, where is a continuation of the primary loading path (which is the path that would be followed if there was no unloading).
- If loading is now stopped at , the path is followed on unloading and then retraced back to on reloading.
- If no further loading beyond is applied, the curve represents the subsequent material response, which is then elastic.
- For loading beyond , the primary path is again followed and the pattern described is repeated.
This is an ideal representation of Mullins effect because in practice there is some permanent set on unloading and/or viscoelastic effects such as hysteresis. Points such as and might not exist in reality in the sense that unloading from the primary curve followed by reloading to the maximum strain level attained earlier usually results in a stress that is somewhat lower than the stress corresponding to the primary curve. In addition, the cyclic response for some filled elastomers shows evidence of progressive damage during unloading from and subsequent reloading to a certain maximum strain level. Such progressive damage usually occurs during the first few cycles, and the material behavior soon stabilizes to a loading/unloading cycle that is followed beyond the first few cycles. More details regarding the actual behavior and how test data that display such behavior can be used to calibrate the Abaqus model for Mullins effect are discussed later and in Analysis of a solid disc with Mullins effect and permanent set.
We refer to the loading path as the “primary hyperelastic behavior,” which is defined using a hyperelastic material model.
Stress softening is interpreted as being due to damage at the microscopic level. As the material is loaded, the damage occurs by the severing of bonds between filler particles and the rubber molecular chains. Different chain links break at different deformation levels, thereby leading to continuous damage with macroscopic deformation. An equivalent interpretation is that the energy required to cause the damage is not recoverable.
Primary Hyperelastic Behavior
Hyperelastic materials are described in terms of a “strain energy potential” function that defines the strain energy stored in the material per unit reference volume (volume in the initial configuration). The quantity is the deformation gradient tensor. To account for Mullins effect, Ogden and Roxburgh propose a material description that is based on an energy function of the form , where the additional scalar variable, , represents damage in the material. The damage variable controls the material properties in the sense that it enables the material response to be governed by an energy function on unloading and subsequent submaximal reloading different from that on the primary (initial) loading path from a virgin state. Because of the above interpretation of , it is no longer appropriate to think of U as the stored elastic energy potential. Part of the energy is stored as strain energy, while the rest is dissipated due to damage. The shaded area in Figure 1 represents the energy dissipated by damage because of deformation until the point , while the unshaded part represents the recoverable strain energy.
The following paragraphs provide a summary of the Mullins effect model in Abaqus. For further details, see Mullins effect. In preparation for writing the constitutive equations for Mullins effect, it is useful to separate the deviatoric and the volumetric parts of the total strain energy density as
In the above equation U, , and are the total, deviatoric, and volumetric parts of the strain energy density, respectively. All the hyperelasticity models in Abaqus use strain energy potential functions that are already separated into deviatoric and volumetric parts. For example, the polynomial models use a strain energy potential of the form
where the symbols have the usual interpretations. The first term on the right represents the deviatoric part of the elastic strain energy density function, and the second term represents the volumetric part.
Modified Strain Energy Density Function
The Mullins effect is accounted for by using an augmented energy function of the form
where is the deviatoric part of the strain energy density of the primary hyperelastic behavior, defined, for example, by the first term on the right-hand side of the polynomial strain energy function given above; is the volumetric part of the strain energy density, defined, for example, by the second term on the right-hand-side of the polynomial strain energy function given above; represent the deviatoric principal stretches; and represents the elastic volume ratio. The function is a continuous function of the damage variable and is referred to as the “damage function.” When the deformation state of the material is on a point on the curve that represents the primary hyperelastic behavior, , , , and the augmented energy function reduces to the strain energy density function of the primary hyperelastic behavior. The damage variable varies continuously during the course of the deformation and always satisfies . The above form of the energy function is an extension of the form proposed by Ogden and Roxburgh to account for material compressibility.
Stress Computation
With the above modification to the energy function, the stresses are given by
where is the deviatoric stress corresponding to the primary hyperelastic behavior at the current deviatoric deformation level and is the hydrostatic pressure of the primary hyperelastic behavior at the current volumetric deformation level . Therefore, the deviatoric stress as a result of Mullins effect is obtained by scaling the deviatoric stress of the primary hyperelastic behavior with the damage variable . The pressure stress is the same as that of the primary behavior. The model predicts loading/unloading along a single curve (that is different, in general, from the primary hyperelastic behavior) from any given strain level that passes through the origin of the stress-strain plot. It cannot capture permanent strains on removal of the load. The model also predicts that a purely volumetric deformation will not have any damage or Mullins effect associated with it.
Damage Variable
The damage variable, , varies with the deformation according to
where is the maximum value of at a material point during its deformation history; r, , and m are material parameters; and is the error function defined as
When , corresponding to a point on the primary curve, . However, attains its minimum value, , given by
on removal of deformation, when . For all intermediate values of , varies monotonically between and . While the parameters r and are dimensionless, the parameter m has units of energy density (that is, energy per unit volume), which is equivalent to stress units. The equation for reduces to that proposed by Ogden and Roxburgh when . The material parameters can be specified directly or can be computed by Abaqus based on curve-fitting of unloading-reloading test data. These parameters are subject to the restrictions , , and (the parameters and m cannot both be zero). Alternatively, the damage variable can be defined through user subroutine UMULLINS in Abaqus/Standard and VUMULLINS in Abaqus/Explicit.
If the parameter and the parameter m has a value that is small compared to , the slope of the stress-strain curve at the initiation of unloading from relatively large strain levels might become very high. As a result, the response might become discontinuous, as illustrated in Figure 2.

This kind of behavior might lead to convergence problems in Abaqus/Standard. In Abaqus/Explicit the high stiffness leads to very small stable time increments, thereby leading to a degradation in performance. You can avoid this problem by choosing a small value for . The choice can be used to define the original Ogden-Roxburgh model. The default value of is 0 in Abaqus/Standard and 0.1 in Abaqus/Explicit.
The parameters r, , and m do not have direct physical interpretations in general. The parameter m controls whether damage occurs at low strain levels. If , there is a significant amount of damage at low strain levels. On the other hand, a nonzero m leads to little or no damage at low strain levels. For further discussion regarding the implications of this model to the energy dissipation, see Mullins effect. The qualitative effects of varying the parameters r and individually, while holding the other parameters fixed, are shown in Figure 3.

The figure on the left shows the unloading-reloading curve from a certain maximum strain level for increasing values of r. It suggests that the parameter r controls the amount of damage, with decreasing damage for increasing r. This behavior follows from the fact that the larger the value of r, the less the damage variable can deviate from unity. The figure on the right shows the unloading-reloading curve from a certain maximum strain level for increasing values of . It suggests that increasing also leads to lower amounts of damage. The figure also shows that the unloading-reloading response approaches the asymptotic response given by , where is the minimum value of , faster for lower values of . The dashed curves represent the asymptotic response at two different values of ( and ). For fixed values of r and m, is a function of . In particular, if ,
The above relation is approximately true if is much greater than m.
Specifying the Mullins Effect Material Model in Abaqus
The primary hyperelastic behavior is defined using the hyperelastic material model (see Hyperelastic Behavior of Rubberlike Materials). The Mullins effect model can be defined by specifying the Mullins effect parameters directly or by using test data to calibrate the parameters.
Specifying the Parameters Directly
The parameters r, m, and of the Mullins effect can be given directly as functions of temperature and/or field variables.
Input File Usage
MULLINS EFFECT, DEFINITION=OGDEN-ROXBURGH
Abaqus/CAE Usage
Property module: material editor: : Definition: Constants
Using Test Data to Calibrate the Parameters
Experimental unloading-reloading data from different strain levels can be specified for up to three simple tests: uniaxial, biaxial, and planar. Abaqus then computes the material parameters using a nonlinear least-squares curve fitting algorithm. It is generally best to obtain data from several experiments involving different kinds of deformation over the range of strains of interest in the actual application and to use all these data to determine the parameters. It is also important to obtain a good curve-fit for the primary hyperelastic behavior if the primary behavior is defined using test data.
By default, Abaqus attempts to fit all three parameters to the given data. This is possible in general, except in the situation when the test data correspond to unloading-reloading from only a single value of . In this case the parameters m and cannot be determined independently; one of them must be specified. If you specify neither m nor , Abaqus needs to assume a default value for one of these parameters. In light of the potential problems discussed earlier with , Abaqus assumes that in the above situation. The curve-fitting can also be carried out by specifying any one or two of the material parameters to be fixed, predetermined values.
As many data points as required can be entered from each test. It is recommended that data from all three tests (on samples taken from the same piece of material) be included and that the data points cover unloading/reloading from/to the range of nominal strain expected to arise in the actual loading.
The strain data should be given as nominal strain values (change in length per unit of original length). The stress data should be given as nominal stress values (force per unit of original cross-sectional area). These tests allow for entering both compression and tension data. Compressive stresses and strains are entered as negative values.
For each set of test input, the data point with the maximum nominal strain identifies the point of unloading. This point is used by the curve-fitting algorithm to compute for that curve.
Figure 4 shows some typical unloading-reloading data from three different strain levels.

The data include multiple loading and unloading cycles from each strain level. As Figure 4 indicates, the loading/unloading cycles from any given strain level do not occur along a single curve, and there is some amount of hysteresis. There is also some amount of permanent set on removal of the applied load. The data also show evidence of progressive damage with repeated cycling at any given maximum strain level. The response appears to stabilize after a number of cycles. When such data are used to calibrate the Mullins effect model, the resulting response will capture the overall stiffness characteristics, while ignoring effects such as hysteresis, permanent set, or progressive damage. The above data can be provided to Abaqus in the following manner:
-
The primary curve can be made up of the data points indicated by the dashed curve in Figure 4. Essentially, this consists of an envelope of the first loading curves to the different strain levels.
-
You can specify the unloading-reloading curves from the three different strain levels by providing the data points as is; that is, as the repeated unloading-reloading cycles shown in Figure 4. As discussed earlier, you need to provide the data from the different strain levels as different tables so that they can be distinguished . For example, assuming that the test data correspond to the uniaxial tension state, three tables of uniaxial test data are required for the three different strain levels shown in Figure 4. In this case Abaqus will provide a best fit using all the data points (from all strain levels). The resulting fit would result in a response that is an average of all the test data at any given strain level. While permanent set can be modeled (see Permanent Set in Rubberlike Materials), hysteresis will be lost in the process.
-
Alternatively, you can provide any one unloading-reloading cycle from each different strain level. If the component is expected to undergo repeated cyclic loading, the latter might be, for example, the stabilized cycle at each strain level. On the other hand, if the component is expected to undergo predominantly monotonic loading with perhaps small amounts of unloading, the very first unloading curve at each strain level might be the appropriate input data for calibrating the Mullins coefficients.
Once the Mullins effect constants are determined, the behavior of the Mullins effect model in Abaqus is established. However, the quality of this behavior must be assessed: the prediction of material behavior under different deformation modes must be compared against the experimental data. You must judge whether the Mullins effect constants determined by Abaqus are acceptable, based on the correlation between the Abaqus predictions and the experimental data. Single-element test cases can be used to derive the nominal stress–nominal strain response of the material model.
The steps that can be taken for improving the quality of the fit for the Mullins effect parameters are similar in essence to the guidelines provided for curve fitting the primary hyperelastic behavior (see Hyperelastic Behavior of Rubberlike Materials for details). In addition, the quality of the fit for the Mullins effect parameters depends on a good fit for the primary hyperelastic behavior, if the primary behavior is defined using test data.
You can evaluate the quality of the fit by carrying out a numerical experiment with a single element that is loaded in the same mode for which test data has been provided. Alternatively, you can obtain the numerical response for both the primary and the softening behavior by requesting model definition data output (see About Output) and carrying out a data check analysis. The response computed by Abaqus is printed in the data (.dat) file along with the experimental data. This tabular data can be plotted in Abaqus/CAE for comparison and evaluation purposes. The primary hyperelastic behavior can also be evaluated with the automated material evaluation tools in Abaqus/CAE.
Input File Usage
MULLINS EFFECT, DEFINITION=OGDEN-ROXBURGH, TEST DATA INPUT, BETA and/or M and/or R
In addition, use at least one and up to three of the following options to give the unloading-reloading test data (see Experimental Tests):
UNIAXIAL TEST DATA
BIAXIAL TEST DATA
PLANAR TEST DATA
You can enter multiple unloading-reloading curves from different strain levels for any given test type by repeating the specification of the appropriate test data option.
Abaqus/CAE Usage
Property module: material editor: : Definition: Test Data Input: enter the values for up to two of the values r, m, and beta. In addition, select and enter data for at least one of the following: , , or
Exponential and Slow Decay Softening
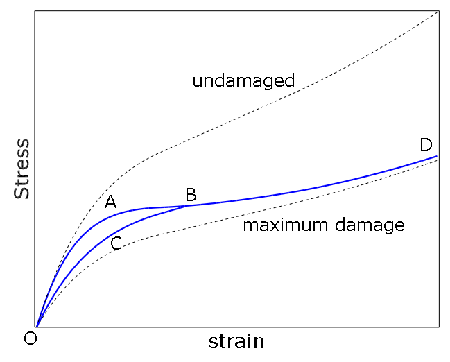
The exponential and slow decay softening models use an approach based on continuum damage mechanics, with the damaged stress-strain curve deviating from the (undamaged) hyperelastic response specified for the material even under monotonic loading conditions.
Figure 5 graphically depicts the material response and the evolution of the damage variable. The top dashed line shows the hyperelastic response of the undamaged material, the bottom dashed line shows the response of the material that reached the maximum degradation, and the solid line shows the actual response of the material, which includes softening. As shown:
- When the material is loaded (path OAB) the damage variable evolves and the stress response deviates from that of the undamaged material.
- If the specimen is subsequently unloaded and reloaded along the path OCB, the damage variable will remain constant and material response is hyperelastic until the previous maximum value of stretch is reached (point B).
- From this point, if the stretches increase, the damage variable will further evolve and softening will take place (path BD).
- Damage continues until the maximum specified value ( ) is reached.
This behavior is different from the approach used by the Ogden-Roxburgh model, where the material always follows the specified hyperelastic response under monotonic loading, and the damage variable changes in value during unloading and reloading.
Strain Energy Density Function
The strain energy is split into the deviatoric and volumetric parts in a way that is similar to what is done for the Ogden-Roxburgh model, and softening affects only the deviatoric response. The strain energy function has the following form
where is the deviatoric part of the strain energy density of the undamaged hyperelastic behavior, is the volumetric part of the strain energy density, represent the deviatoric principal stretches; and represents the elastic volume ratio.
The stresses are obtained from the following formula
where is the deviatoric stress corresponding to the undamaged hyperelastic behavior at the current deviatoric deformation level , and is the hydrostatic pressure of the undamaged hyperelastic behavior at the current volumetric deformation level .
Damage Variable
To complete the description of the model, the damage variable must be specified. Two forms are available to describe the evolution of the damage variable: the exponential form and the slow decay form. Both describe the evolution of damage as a monotonic function of maximum strain energy, .
The exponential form is given by
where is the maximum value of at a material point during its deformation history; , and are material parameters, and represents the minimum value of , corresponding to the maximum value of damage ( ).
The slow decay form is given by
Specifying the Mullins Effect Material Model with Exponential and Slow Decay Forms of Damage Variable Evolution in Abaqus
You define the undamaged material behavior using the hyperelastic material model (see Hyperelastic Behavior of Rubberlike Materials). You define the exponential and slow decay forms of the damage variable evolution by specifying the , and parameters directly (optionally as functions of temperature and/or field variables).
Input File Usage
Use the following option to define parameters for the exponential form of the evolution of the damage variable.
MULLINS EFFECT, DEFINITION=EXPONENTIAL
Input File Usage
Use the following option to define parameters for the slow decay form of the evolution of the damage variable.
MULLINS EFFECT, DEFINITION=SLOW DECAY
Convergence Difficulties in Abaqus/Standard
Models with the exponential and slow decay forms of the damage variable might exhibit strain softening behavior as presented in Figure 6 for certain values of material parameters (for example such as to model material degradation and failure). This leads to instabilities and strain localization effects that often cause severe convergence difficulties in implicit analysis programs, such as Abaqus/Standard. Therefore, Abaqus/Standard should not be used in such cases, and it is recommended to use Abaqus/Explicit instead.

Limitations
Specifying stress initial conditions is not supported with the exponential and slow decay softening.
User Subroutine Specification
An alternative method for defining the Mullins effect involves defining the damage variable in user subroutine UMULLINS in Abaqus/Standard and VUMULLINS in Abaqus/Explicit. Optionally, you can specify the number of property values needed as data in the user subroutine. You must provide the damage variable, , and its derivative, . The latter contributes to the Jacobian of the overall system of equations and is required to ensure good convergence characteristics in Abaqus/Standard. If needed, you can specify the number of solution-dependent variables (About User Subroutines and Utilities). These solution-dependent variables can be updated in the user subroutine. The damage dissipation energy and the recoverable part of the energy can also be defined for output purposes.
User subroutines UMULLINS and VUMULLINS can be used in combination with all hyperelastic potentials in Abaqus, including user-defined potentials (by means of user subroutines UHYPER, UANISOHYPER_INV, and UANISOHYPER_STRAIN in Abaqus/Standard, and VUANISOHYPER_INV and VUANISOHYPER_STRAIN in Abaqus/Explicit).
Input File Usage
MULLINS EFFECT, DEFINITION=USER, PROPERTIES=constants
Abaqus/CAE Usage
Property module: material editor: : Definition: User Defined
Viscoelasticity
When viscoelasticity is used in combination with Mullins effect, stress softening is applied to the long-term behavior.
In this case you should specify the parameters carefully. If the underlying hyperelastic behavior is defined with an instantaneous modulus, and are interpreted to be instantaneous. Otherwise, and are considered to be long term. The parameters and have units of energy density (that is, energy per unit volume), which is equivalent to stress units.