Stylizing line-type contours | ||||||
|
| |||||
Context:
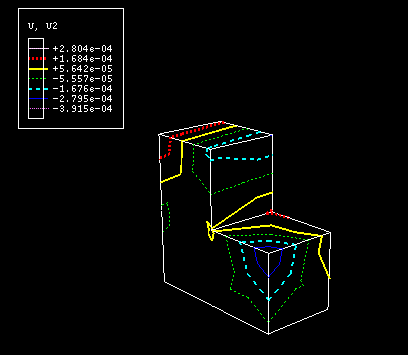
This option is particularly useful when colors are not available; for example, for black and white hard-copy plotting. Figure 1 shows a contour plot with customized contour lines.

You customize the colored lines one color (interval) at a time, referring to each interval by its position in the contour legend. Interval number 1 is the first colored line starting from the bottom of the contour plot legend. For information on the contour legend, see Customizing the legend.
 in the toolbox. Click the