Contouring line-shaped elements with tick mark contour plots | |||||
|
| ||||
Context:
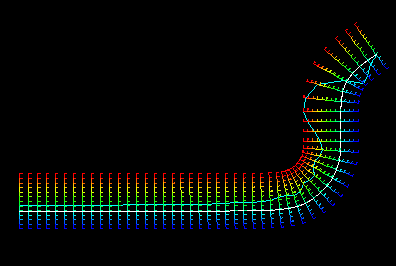
A tick mark contour plot shows the contour curve drawn between sets of lines that are normal to the actual elements. The contour level is indicated by “tick marks” on these normal lines. Abaqus displays the contour curve only when it falls within the limits you have specified. For more information on limiting the range of the plot, see Setting contour limits.
Figure 1 shows the appearance of a tick mark contour plot.

The normal lines, or tick mark axes, are drawn at nodes. At part boundaries, two tick mark axes are drawn. Within a part, if the angle between two adjacent line elements is less than the specified feature angle, a single tick mark axis is drawn in the direction of the average normal of elements sharing the node. Otherwise, a tick mark axis is drawn normal to each element sharing the node. When averaging normals, only displayed elements of the same type are considered in the calculation.
 in the toolbox; then click the