Customizing the legend | ||
| ||
Context:
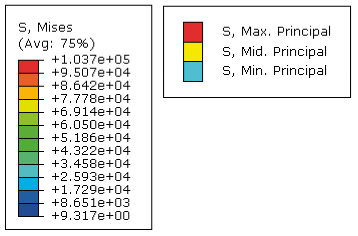
Figure 1 shows a contour plot legend and a symbol plot legend.

You can display or suppress legends for all plot states, and you can customize the following:
the position of the legend,
the font and color of the legend text,
the appearance of a box outlining the legend,
whether minimum and maximum plot values are shown,
the appearance of the legend background (the rectangular area behind the legend),
the formatting of the numbers displayed for the digit values, and
the number of digits displayed for the legend values.
You cannot directly specify the size of the legend. However, by varying the size of the text font or the number of digits in the legend values, you can increase or decrease the legend's size.
The content of the legend depends on the plot type and on plot state–specific options such as the number of contour intervals. For more information on contour plot legend content, see Understanding contour plotting.
This section describes how to customize the legend for all plot states except X–Y plots. To customize the X–Y plot legend, see Customizing the X–Y plot legend.
 .
.