Progressive failure analysis of thin-wall aluminum extrusion under quasi-static and dynamic
loads
In this example problem we consider the overall deformation and failure behavior of a
thin-wall, double-chambered aluminum extrusion under quasi-static three-point bending and
dynamic axial loading conditions.
The following Abaqus features are demonstrated:
using ductile, shear, and Müschenborn-Sonne forming limit diagram
(MSFLD) damage initiation criteria to study the
initiation of failure due to three different mechanisms: ductile fracture, shear band
formation, and necking instability, respectively; and
modeling progressive failure of components using damage evolution and element removal.
The overall load-displacement response and the fracture patterns are compared with the
experimental results given by Hooputra et al. (2004).
New materials such as aluminum and magnesium alloys and high-strength steels are being
introduced increasingly in automotive components to reduce weight and, hence, to increase
overall vehicle performance. These materials typically have low ductility at fracture
compared to traditional steels and may suffer damage and failure under crash loading
conditions. A typical component made of sheet metal may undergo damage due to a number of
mechanisms including void nucleation and coalescence, shear band formation, and necking
instability. Thus, to obtain reliable predictions from crashworthiness simulations, it is
essential to model damage initiation and progressive failure due to various failure
mechanisms as well as modeling accurate plastic deformation behavior.
Geometry
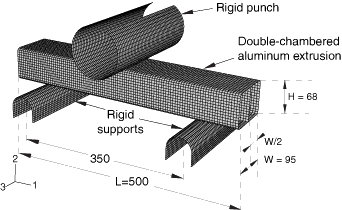
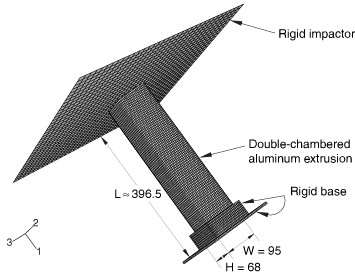
The three-point bending and the axial crushing configurations are shown in Figure 1 and Figure 6, respectively. The overall dimensions of the aluminum extrusion are
L=500 mm, W=95 mm, and
H=68 mm for the three-point bending case and
L≈396.5 mm, W=95 mm, and
H=68 mm for the axial crushing case. The thickness of the
sheet is 2.5 mm for both cases.
Materials
The material used in this study is an extruded aluminum alloy EN AW-7108
T6. This material behaves in an elastic-plastic manner and can undergo
damage due to either one or a combination of the following damage mechanisms: nucleation
and coalescence of voids, shear band formation, and necking instability.
Boundary conditions and loading
The three-point bending configuration consists of the aluminum extrusion supported on two
rigid cylinders and loaded in the transverse direction by another rigid cylinder (Figure 1). In the axial crushing simulation, one end of the aluminum extrusion is supported by a
fixed rigid base and the other end is subjected to an instantaneous velocity by a planar
rigid impactor (Figure 6).
Abaqus modeling approaches and simulation techniques
Two loading cases are considered. The first case consists of a quasi-static three-point
bending configuration where the part is loaded transversely to the extrusion direction. In
the second case the part is subjected to a dynamic loading in the axial (extrusion)
direction.
Summary of analysis cases
Case 1
Quasi-static three-point bending simulation.
Case 2
Dynamic axial crushing simulation.
The sections that follow discuss the analysis considerations that are applicable to both
cases.
Mesh design
In both cases the mesh is similar to that used by Hooputra et al. (2004). The aluminum
extrusion is meshed with a uniform mesh consisting primarily of 4-node shell elements
(S4R). In the axial crushing case some 3-node shell
elements (S3R) are also used. The planar dimensions of
the elements are an order of magnitude larger than the shell thickness. The simulations
with this mesh yield results in agreement with the experimental observations. No mesh
refinement studies were conducted.
Materials
The details of the Abaqus models used for constitutive behavior and progressive damage analysis are discussed
below. Guidelines for obtaining the material parameters from experimental data are also
provided.
Elastoplasticity
Hooputra et al. (2004) have shown that the extruded aluminum alloy EN
AW-7108 T6 displays plastic orthotropy due to the nature of the
extrusion processing and have used the Barlat symmetric yield locus (Barlat et al.,
1991) to fit the experimental data. In this example we neglect the orthotropy and assume
both the elastic and the plastic behavior to be isotropic with the yield surface
described by the Mises yield function (see Inelastic Behavior). The
assumption of isotropic plasticity may appear to be too restrictive for the accurate
prediction of failure in extruded alloys. However, in crashworthiness simulations the
assumption of isotropy usually yields acceptable results when compared with experimental
observations, as shown in the results obtained in this example. Nevertheless, you should
compare your simulation results with experimental data to check the validity of the
isotropic plasticity assumption.
Damage initiation
Metal sheets and thin-walled extrusions made of aluminum alloys may fail due to one or
a combination of the following failure mechanisms (Hooputra et al. 2004): ductile
failure due to nucleation, growth, and coalescence of voids; shear failure due to
fracture within shear bands; and failure due to necking instabilities. If the model
consists of shell elements, a criterion for the last failure mechanism is necessary
because the size of the localized neck is of the order of the sheet thickness and,
hence, cannot be resolved with shell elements of dimensions one order of magnitude
larger than the thickness.
Abaqus/Explicit offers a number of damage initiation criteria to model the onset of necking
instabilities in sheet metals. These include the Forming Limit Diagram
(FLD), Forming Limit Stress Diagram
(FLSD), Müschenborn-Sonne Forming Limit Diagram
(MSFLD), and Marciniak-Kuczynski
(M-K) criteria. The first three criteria utilize the
experimentally measured forming limit curves in the appropriate strain or stress spaces.
The last criterion introduces virtual thickness imperfections in the sheet metal and
analyzes the deformation in the imperfection zone to determine the onset of the
instability (see Damage Initiation for Ductile Metals).
The strain-based FLD criterion is limited to
applications where the strain path is linear. On the other hand, the stress-based
FLSD criterion is relatively insensitive to changes in
the strain path. However, this apparent independence of the stress-based limit curve due
to the strain path may simply reflect the small sensitivity of the yield stress to
changes in the plastic deformation. The M-K criterion
can capture the effects of nonlinear strain paths accurately; however, it is
computationally expensive, especially if large numbers of imperfection orientations are
introduced. It has been verified that the results obtained using the
MSFLD criterion are similar to those obtained using the
M-K criterion but with a much reduced computational
expense (see Progressive damage and failure of ductile metals). Therefore,
in this example we choose the MSFLD damage initiation
criterion for necking instability.
For specifying the MSFLD damage initiation criterion,
the forming limit curve of the material is required. In Abaqus this criterion can be specified by converting the forming limit curve from the space
of major versus minor strains to the space of equivalent plastic strain versus ratio of
principal strain rates. Abaqus also allows direct specification of the forming limit curve for the
MSFLD criterion (see Müschenborn-Sonne Forming Limit Diagram (MSFLD) Criterion). We use the
forming limit curve based on the experimental work of Hooputra (2005). This curve is
assumed to be valid at both the quasi-static and the dynamic strain rates. The parameter
OMEGA used in conjunction with the
MSFLD criterion to provide filtering of numerical noise
in the evaluation of the ratio of principal strain rates is set to 0.001 in both cases
(see Damage Initiation for Ductile Metals); this value
is recommended for crashworthiness simulations.
Damage due to initiation, growth, and coalescence of voids leads to ductile failure in
metals; the formation of cracks within shear bands leads to shear failure. Abaqus offers phenomenological damage initiation criteria for both of these mechanisms. The
ductile criterion is specified by providing the equivalent plastic strain at the onset
of ductile damage as a function of stress triaxiality and strain rate. Similarly, the
shear criterion is specified by providing the equivalent plastic strain at the onset of
shear damage as a function of shear stress ratio and strain rate (see Damage Initiation for Ductile Metals). The data
required for both of these criteria may be difficult to obtain through direct
experimentation since it would require experiments spanning a range of stress
triaxiality and shear stress ratio that may be difficult to achieve. Hooputra et al.
(2004) have given simplified analytical expressions for the ductile and the shear
failure criteria that require only a limited number of experiments. In this example we
adopt those expressions; however, we ignore the orthotropy of the ductile fracture to be
consistent with the assumption of isotropic plasticity made earlier.
For the ductile damage initiation criterion the equivalent plastic strain is given by
the following function of the stress triaxiality, (Hooputra et al, 2004):
where and correspond to the equivalent plastic strain at ductile damage
initiation for equibiaxial tensile and equibiaxial compressive deformation,
respectively. For isotropic materials the stress triaxiality in equibiaxial tensile
deformation state, , is , and in equibiaxial compressive deformation state, , is . The definition of in Abaqus, as a ratio of the equivalent mean stress to the Mises equivalent stress, differs
from that used by Hooputra et al. (2004) by a factor of . Consequently, the value of used in the above expression is three times the value used in Hooputra
et al. (2004). The above expression has three parameters that must be obtained
experimentally: , , and . These parameters depend on the material, strain rate, and possibly
the temperature. For each strain rate of interest, three experiments are needed at
different values of stress triaxiality to obtain the three material parameters. can be obtained directly from the Erichsen test (). Three-point bending of sheet coupons (with width/thickness > 4)
under plane strain tension () and fracture at the notch root of waisted tensile coupons in uniaxial
tension () may provide two additional experiments to determine and . In the Erichsen and three-point bending experiments the local
fracture strain can be derived by placing a grid on the specimen's surface; in the
waisted tensile experiment the fracture strain can be obtained from the sheet thickness
in the fracture plane (Hooputra et al., 2004). For the aluminum alloy used in this
example the experimentally obtained ductile failure parameters at quasi-static and
dynamic strain rates (250 s−1) are listed in Table 1.
For the shear damage initiation criterion the equivalent plastic strain at the onset of
damage is given by the following function of the shear stress ratio, (Hooputra et al, 2004):
where with , and and correspond to the equivalent plastic strain at shear damage initiation
for equibiaxial tensile and equibiaxial compressive deformation, respectively. The
parameters and correspond to the values of at and , respectively. This expression has four parameters that must be
determined experimentally: , , , and . These parameters depend on the material and strain rate. Hooputra et
al. (2004) have used tensile specimens with a groove (rectangular cross-section and
groove depth=half the sheet thickness) at to the loading direction (), specially designed tensile specimens with a groove parallel to the
loading direction (pure shear, ), and Erichsen tests () in conjunction with the above expression to determine , , and . The value of the material parameter is taken as 0.3. For the aluminum alloy used in this example the
experimentally obtained shear failure parameters at quasi-static and dynamic strain
rates (250 s−1) are listed in Table 2.
Using the aforementioned expressions and the material parameters listed in Table 1 and Table 2, tabular data for ductile and shear damage initiation criteria can be generated as a
function of stress triaxiality and shear stress ratio, respectively. This tabular data
is provided in the Abaqus input files. The above expressions may give very high values of the equivalent
plastic strain at damage initiation when the stress triaxiality or the shear stress
ratio is very small. A cutoff value of the equivalent plastic strain can be provided in
such cases.
Damage evolution and element removal
Damage evolution occurs once the damage initiation criteria are satisfied. Plastic
displacement-based linear damage evolution law is used for each of the three damage
initiation criterion. The value of the plastic displacement at which the damage variable
reaches 1 is taken as 0.1. The default maximum degradation rule is used, and the
elements are removed from the mesh once the maximum degradation has occurred (see Maximum Degradation and Choice of Element Removal).
Initial conditions
For the axial crushing simulation a velocity initial condition is specified at the
reference node of the planar rigid impactor in the global 1-direction.
Boundary conditions
For the three-point bending simulation all the degrees of freedom at the reference node
of the rigid supports are constrained. A velocity boundary condition in the global
2-direction is specified at the reference node of the rigid punch with all the remaining
degrees of freedom constrained.
For the axial crushing simulation all the degrees of freedom at the reference node
associated with the rigid support are constrained. Furthermore, all of the degrees of
freedom except that associated with the global 1-direction are constrained at the
reference node of the planar rigid impactor.
Loads
The velocity boundary condition at the rigid punch applies the load in the three-point
bending simulation. In the case of the axial crushing simulation the initial velocity of
the planar rigid impactor loads the component.
Constraints
Rigid body constraints are specified in both cases to form element-based rigid bodies.
These rigid bodies form the support and apply loads to the aluminum extrusion.
Interactions
For the three-point bending simulation a contact pair interaction is defined between the
rigid punch and the node-based surface of the aluminum extrusion component. A general
contact interaction is defined between the rigid cylinders forming the support and the
element-based surface of the aluminum extrusion component. In addition, self-contact is
defined between the element-based surfaces of the extruded component. A friction
coefficient of 0.05 is used for the contact between the rigid cylinders and the extruded
component, and a value of 0.15 is used for the self-contact.
For the axial crushing simulation a contact pair interaction is defined between the
extruded component and the rigid support as well as between the component and the rigid
impactor. A general contact interaction is used for self-contact between the surfaces of
the extruded component. A friction coefficient of 0.15 is used for all of the contact
interactions in this case.
For both the three-point bending and axial crushing cases, a penalty-type mechanical
constraint is used for all of the contact pair definitions.
Analysis steps
Both the three-point bending and the axial crushing analyses consist of one explicit
dynamic step. The total simulation times in the three-point bending and the axial crushing
cases are 0.072 s and 0.0501 s, respectively. Both the analyses consider geometric
nonlinearity and use automatic time incrementation using element-by-element stable time
increment estimates.
Output requests
For both cases the field output request includes the following quantities: displacement,
stress, strain, element status, and damage initiation criteria variables. The history
output request consists of displacement, velocity, acceleration, and reaction force at the
reference point of the top rigid cylinder (for the three-point bending simulation) and at
the reference point of the rigid impactor and the supporting base (for the axial crushing
simulation). Energy output variables are requested for the entire model.
Discussion of results and comparison of cases
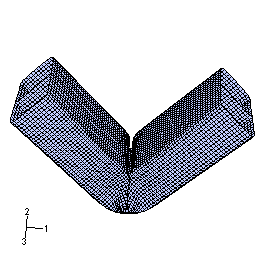
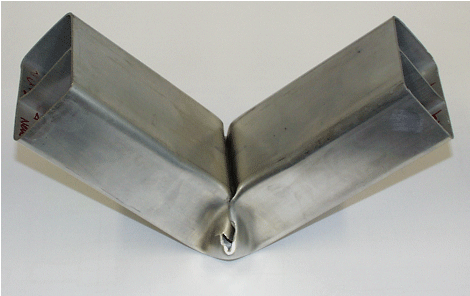
The overall deformed shape of the aluminum extrusion obtained from the three-point bending
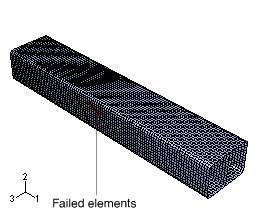
simulation is shown in Figure 2, and the experimentally observed deformed shape (Hooputra et al. 2004) is shown in Figure 3. The elements that have failed at the end of the simulation are shown in Figure 4, mapped into the undeformed configuration. Good qualitative agreement is seen between the
simulation results and experimental observations. The load-displacement history of the punch
obtained from the simulation is compared with three different experimental results in Figure 5. Again, a very good match is observed, indicating the reliability of the simulation
results. In Figure 5 the simulation results are plotted after applying the Butterworth filter with a cutoff
frequency of 1000 (see Applying Butterworth filtering to an X–Y data object).
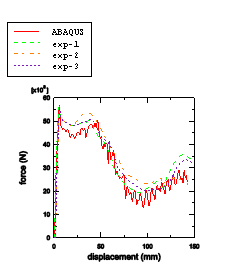
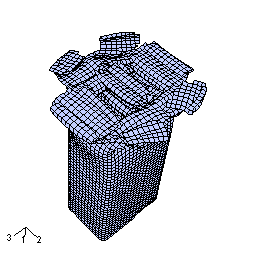
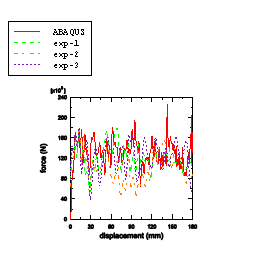
The overall deformed shape including the failure patterns obtained from the axial crushing
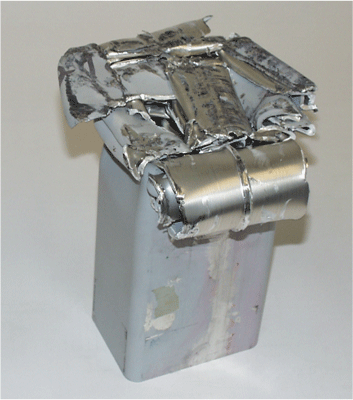
simulation is shown in Figure 7. The deformed shape and the failure patterns are qualitatively similar to those observed
experimentally (Figure 8). The overall force-displacement response from the simulation (filtered using the
Butterworth filter with a cutoff frequency of 1500) is compared with the results from three
different experiments (Hooputra, 2005) in Figure 9. Again, a good qualitative match is seen, and the numerical results are within the
experimentally observed scatter.
In conclusion, the results from both the quasi-static three-point bending and the dynamic
axial crushing simulations match the experimental data very well. It is also concluded that
the use of progressive damage and failure is essential to capture the overall deformation
and failure behavior of thin-wall aluminum extrusion.
Barlat, F., D. J. Lege, and
J. C. Brem, “A Six-Component Yield Function for Anisotropic
Materials,” International Journal of Plasticity, vol. 7, pp. 693–712,
1991.
Hooputra, H., H. Gese,
H. Dell, and H. Werner,
“A Comprehensive Failure Model for
Crashworthiness Simulation of Aluminium Extrusions,” International
Journal of Crashworthiness, vol. 9, pp. 449–463, 2004.
Figure 1. Three-point bending configuration: geometry and finite element mesh. Figure 2. Final deformed shape of the aluminum extrusion in the quasi-static three-point
bending simulation. Figure 3. Deformed shape of the aluminum extrusion in the quasi-static three-point bending
experiment (Hooputra et al., 2004). Figure 4. Completely failed elements at the end of the three-point bending simulation mapped
into the undeformed configuration. Figure 5. Comparison of the force-displacement response obtained from the three-point bending
simulation with the experimental results of Hooputra et al. (2004). Figure 6. Axial crushing configuration: geometry and finite element mesh. Figure 7. Final deformed shape of the aluminum extrusion in the dynamic axial crushing
simulation. Figure 8. Deformed shape of the aluminum extrusion in the dynamic axial crushing experiment
(Hooputra et al., 2004). Figure 9. Comparison of the force-displacement response obtained from the axial crushing
simulation with the experimental results of Hooputra et al. (2004).