Ductile, Johnson-Cook, Hosford-Coulomb, and shear criteria
Elements tested
T2D2
T3D2
B21
B31
SAX1
C3D8
C3D8R
SC8R
S4
S4R
S4RS
CPS4R
CPE4R
CAX4R
M3D4R
M3D4
Features tested
Ductile, shear, and Hosford-Coulomb damage initiation criteria are tested for the
following material models: Mises plasticity; Hill plasticity; Drucker-Prager plasticity;
and, in Abaqus/Explicit, equation of state with Johnson-Cook plasticity. The Johnson-Cook criterion, a special
case of the ductile criterion, is also tested with the following material models: Mises
plasticity, Hill plasticity, Johnson-Cook plasticity, Drucker-Prager plasticity, and
equation of state with Mises plasticity. For the ductile and the shear damage initiation
criteria, the capability to specify initial conditions on the damage initiation measures
is tested. The elastic response of the material is defined using either the linear elastic
material behavior or the hyperelastic behavior.
Problem description
This verification test consists of a set of single-element models subjected to biaxial
tension; an exception is the truss and beam elements, which are loaded by uniaxial
tension. For each material model only those element types supported for that model are
used. The ductile criterion is specified in terms of the plastic strain at the onset of
damage as a tabular function of the stress triaxiality and the equivalent plastic strain
rate. In Abaqus/Explicit the ductile criterion can also be defined as a tabular function of Lode angle. The
Johnson-Cook criterion (available only in Abaqus/Explicit) is specified in terms of failure parameters –, the reference strain rate , the melting temperature, and the transition temperature. The shear
criterion is specified in terms of the plastic strain at the onset of damage as a tabular
function of the shear stress ratio and the equivalent plastic strain rate. The
Hosford-Coulomb criterion (available only in Abaqus/Standard) is specified in terms of failure parameters , , , and . The damage evolution law (available only in Abaqus/Explicit) is specified in terms of the equivalent plastic displacement or in terms of the
fracture energy dissipation. A maximum degradation of 0.75 is set. The default failure
choice (i.e., element deletion) is used in all tests in this subsection.
The tests for initial conditions on the damage initiation measures do not subject the
elements to any deformation. Instead, these tests verify only that the specified initial
conditions are output without any modifications.
Results and discussion
The damage initiation criteria computed by Abaqus agree with the values obtained analytically. For models that include damage evolution,
the material degradation starts when the equivalent plastic strain reaches the specified
damage initiation criterion. The damage variable evolves according to the evolution law
specified in terms of the plastic displacement or energy dissipation. The element is
deleted from the mesh once all the integration points at any one section of an element
fail; the element output variable STATUS
will then be set to zero.
The FLD and
FLSD damage initiation criteria are
tested on elements with a plane stress formulation for the following material models:
Mises plasticity; Hill plasticity; Drucker-Prager plasticity; and, in Abaqus/Explicit, for Johnson-Cook plasticity.
Problem description
This verification test consists of a set of single-element models subjected to
equibiaxial tension. The FLD criterion
is specified in terms of the maximum in-plane principal strain at damage initiation as a
tabular function of the minimum in-plane principal strain. The
FLSD criterion is specified in terms
of the maximum in-plane principal limit stress as a tabular function of the minimum
in-plane principal stress. In Abaqus/Explicit input files the damage evolution law is specified in terms of the equivalent plastic
displacement or in terms of the fracture energy dissipation. A maximum degradation of 0.75
is used. The default failure choice (i.e., element deletion) is used in all tests in this
subsection.
Results and discussion
For the FLD criterion material
degradation starts when the maximum in-plane principal strain reaches the major limit
strain according to the specified forming limit curve. For the
FLSD criterion material degradation
starts when the maximum in-plane principal stress reaches the major limit stress according
to the specified forming limit stress curve. The damage variable evolves according to the
evolution law specified in terms of the plastic displacement or energy dissipation.
The M-K damage initiation criterion is tested for Mises
plasticity in Abaqus/Explicit.
Problem description
First, a set of single elements with plane stress formulation is loaded under equibiaxial
tension to test the M-K damage initiation criterion for
different element types. The material properties for this test correspond to a steel alloy
modeled with rate-dependent Mises plasticity. The initial imperfection size is defined as
a tabular function of the angular direction. The M-K
criterion is specified in terms of the limit ratio of the deformation in the groove
(thickness imperfection) relative to the nominal deformation outside the groove.
In addition, to demonstrate the capability of the M-K
analysis in predicting forming limit diagrams for an aluminum alloy, a set of parametric
studies are performed to evaluate the effect of strain paths on the
FLDs using
S4R elements. In these studies an aluminum
alloy (AA 5754–O) is modeled using isotropic Mises
plasticity with Nadai hardening: , with MPa, , and . The initial imperfection size is assumed to be 0.9999 in these studies.
The number of virtual imperfections is set to 100. A set of analyses are performed with
the ratio between the major and minor principal strain parameterized and kept constant
throughout each individual analysis, which generates the
FLD curve without prestrain. To
evaluate the effect of the loading paths on the
FLDs, two more sets of studies are
performed in which the material is initially prestrained (either with plane strain or
equibiaxial loading) and subsequently subjected to the same type of proportional loading
as in the case without prestrain.
Results and discussion
Material degradation starts when the ratio of the deformation in the groove relative to
the nominal deformation reaches the specified critical value. The damage variable evolves
according to the evolution rule specified in terms of the plastic displacement or energy
dissipation.
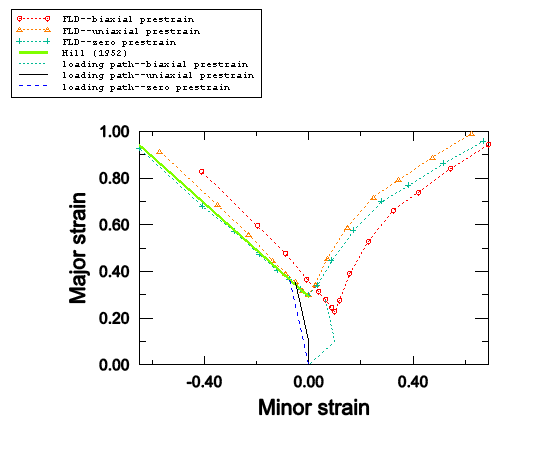
Figure 1
shows the FLD curves predicted with
the M-K analyses for the three sets of parametric studies
described above, along with a typical loading path involved in each study. The predicted
FLD curve with no prestrain matches
the analytical criterion suggested by Hill (1952) in the left side of the
FLD curve (drawing region). The 10%
plane strain prestrain shifts the FLD
curve upward and, thus, increases the forming limit in both the drawing region and the
stretching region. The 10% equibiaxial prestrain moves the
FLD curve downward and to the right;
therefore, the forming limit is increased in some regions while lowered in others. These
results suggest that the FLDs strongly
depend on the loading paths prior to reaching the localization point.
Script file for parametric study of aluminum alloy with biaxial prestrain.
Müschenborn-Sonne forming limit diagram
(MSFLD)
Elements tested
SC8R
S4R
S4RS
CPS4R
M3D4R
M3D4
Features tested
The MSFLD damage initiation criterion
is tested for Mises plasticity. The capability to specify initial conditions on the damage
initiation measure is also tested.
Problem description
A set of single elements with a plane stress formulation is loaded under equibiaxial
tension to test the MSFLD damage
initiation criterion for different element types. The
MSFLD criterion is specified in terms
of the maximum in-plane principal strain at damage initiation as a tabular function of the
minimum in-plane principal strain (FLD
definition) or in terms of the equivalent plastic strain at damage initiation as a tabular
function of the ratio of principal strain rates
(MSFLD definition).
To demonstrate the capability of the
MSFLD criterion in predicting failure
for nonlinear strain paths, a number of numerical simulations of two-step forming
processes have been carried out in Abaqus/Explicit using the MSFLD criterion as well
as the M-K criterion. Each of the two forming steps
follows a linear path with constant principal strain rate ratio , but there can be a jump in the value of from the first step to second step; therefore, the overall deformation
path is not linear. Based on the value of throughout the first step and the value of equivalent plastic strain at
the end of the first step, these simulations are grouped into five sets: within each set,
individual simulations differ only in the value of during the second step. The same material model described in the last
section (AA 5754–O) has also been used here.
The test for initial conditions on the damage initiation measure does not subject the
elements to any deformation. Instead, this test verifies only that the specified initial
conditions are output without any modifications.
Results and discussion
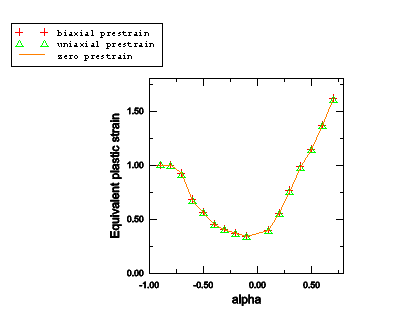
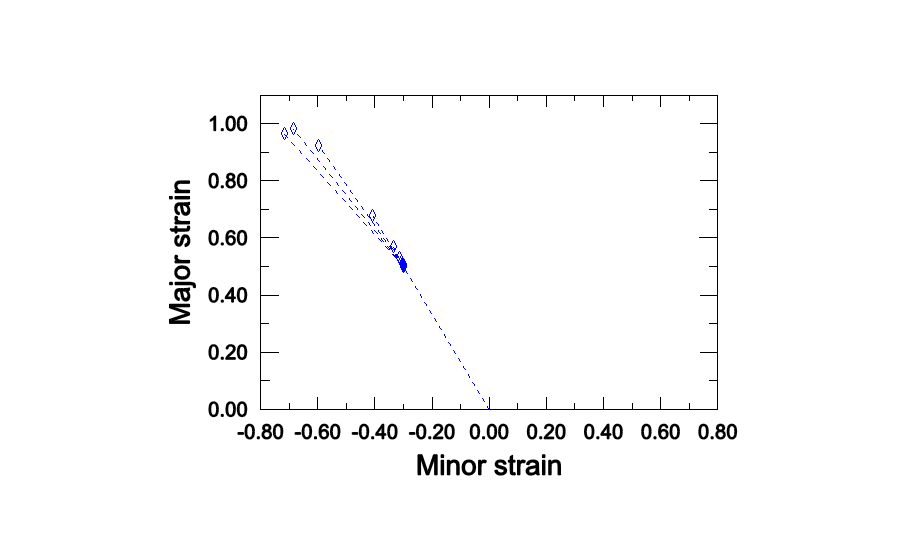
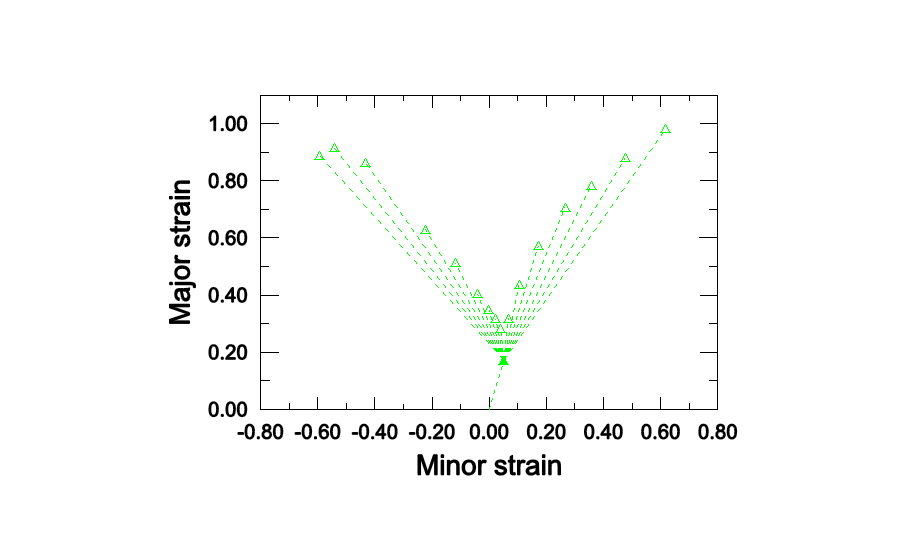
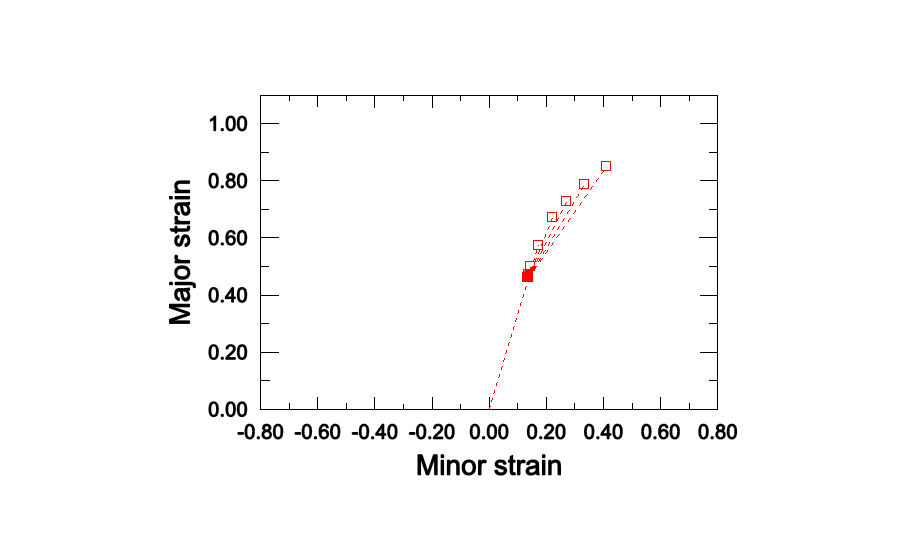
As shown in Figure 1, the forming limit diagrams in the space of major versus minor principal strain
(FLD representation) strongly depend
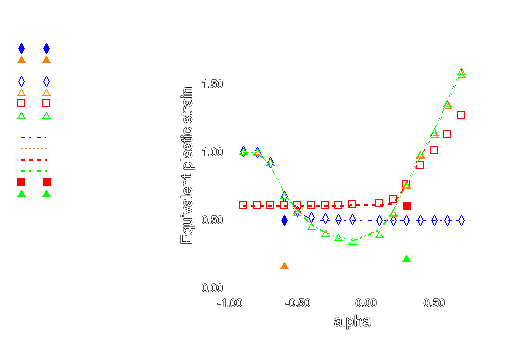
on the loading path. However, by representing the same data from the
M-K analysis in the space of equivalent plastic strain
versus the ratio of principal strain rates
(MSFLD representation), those three
curves fall onto the same curve as shown in Figure 2. This curve has been used to define the
MSFLD criterion for the two-step
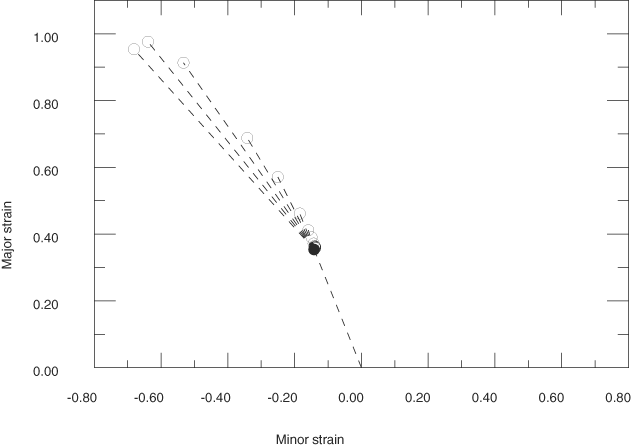
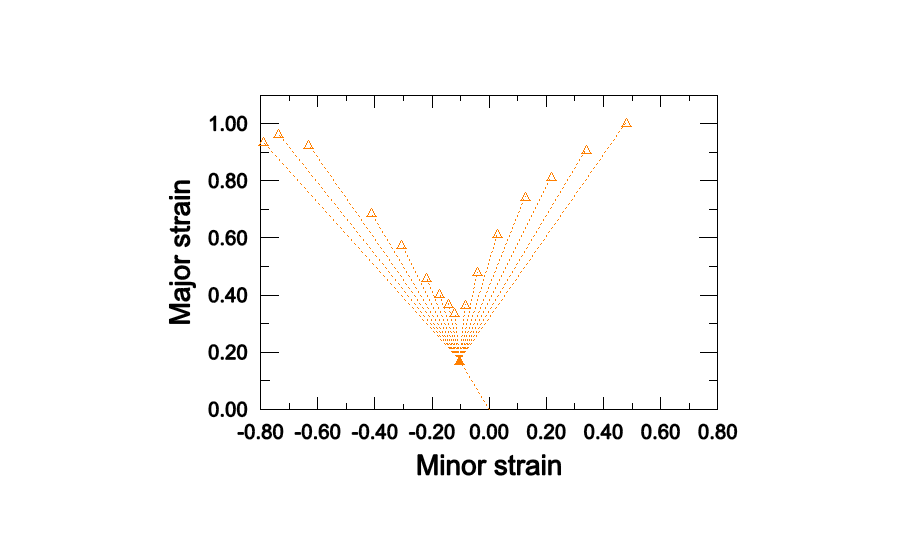
numerical simulations described above. The points of initiation of necking predicted by
the M-K criterion for each of the two-step forming
processes that are being considered are shown in Figure 3, Figure 4, Figure 5, Figure 6, and Figure 7. In these figures the solid symbols represent the material state at the end of the
first forming step (i.e., the starting point for the second loading step) and the
corresponding hollow symbols represent the points of initiation of necking along different
loading paths during the second step. The same data are also plotted in Figure 8 in the - diagram. The dashed lines in Figure 8 connect the necking points obtained using the
MSFLD criterion for each of the
two-step forming processes. As shown in the figure, in most situations the necking
predictions based on the MSFLD compare
remarkably well with those based on the more expensive
M-K analysis. The only case observed in this figure in
which the M-K and
MSFLD criteria are not in close
agreement corresponds to the predeformation of = 0.3 with higher equivalent plastic strain (solid square). In this case
the MSFLD criterion slightly over
predicts the forming limits for deformation states on the right side of the curve. This
situation may be expected to occur when the deformation state of the material gets very
close to the forming limit curve sometime during the loading history and is subsequently
strained in a direction along which it can sustain further deformation. However, this
mismatch can be accounted for through precalibration and the use of a safety factor. These
results indicate that the onset of necking instability occurs when a new deformation state
in the equivalent plastic strain versus principal strain rate ratio space either lies on
the forming limit curve or, upon sudden change in the strain rate ratio, a line connecting
the states just before and after the change in strain rate ratio crosses the forming limit
diagram. This example demonstrates the capability of the
MSFLD criterion in predicting necking
even for the nonlinear strain paths.
Script file for parametric study using M-K
analysis with starting point of = –0.4.
Figures
Figure 2. Forming limit diagrams predicted with M-K analyses
and plotted in the space of equivalent plastic strain versus ratio of principal strain
rates (MSFLD
representation). Figure 3. Forming limits predicted using M-K analyses for
two-step forming processes with starting point of = –0.4. Figure 4. Forming limits predicted using M-K analyses for
two-step forming processes with starting point of = –0.6 and lower equivalent plastic strain. Figure 5. Forming limits predicted using M-K analyses for
two-step forming processes with starting point of = –0.6 and higher equivalent plastic strain. Figure 6. Forming limits predicted using M-K analyses for
two-step forming processes with starting point of = 0.3 and lower equivalent plastic strain. Figure 7. Forming limits predicted using M-K analyses for
two-step forming processes with starting point of = 0.3 and higher equivalent plastic strain. Figure 8. Comparison of forming limit diagrams predicted using
MSFLD criterion and those using
M-K analyses. (Solid symbols: state at end of first
step for various type of loading. Hollow symbols: state corresponding to initiation of
necking during the second step predicted using the M-K
analyses. Dashed lines: necking points obtained using the
MSFLD criterion. Refer to the input
file descriptions for an explanation of the labels.)
Element deletion
Elements tested
T2D2
T3D2
C3D8
C3D8R
CPE4R
CAX4R
Features tested
The nondefault degradation behavior is tested in Abaqus/Explicit by specifying that fully damaged elements should remain in the computations.
Problem description
The ductile initiation criterion is used on a set of single-element models, subjected to
plane strain compression followed by plane strain tension for the elements with
two-dimensional and three-dimensional stress states. The truss elements are loaded in
uniaxial compression followed by uniaxial tension.
Results and discussion
For elements with two-dimensional and three-dimensional stress states, only the
deviatoric and tensile hydrostatic response of the material are degraded once the damage
initiation criterion is met; the compressive hydrostatic response is not degraded. For
elements with one-dimensional stress states, the stress component is degraded only when it
is positive. All elements remain active when element deletion is not used.
The maximum and multiplicative rules for computing the overall damage variable from each
individual damage variable contribution are tested in Abaqus/Explicit. The field and temperature dependence of the damage initiation criteria and the damage
evolution rules are also tested.
Problem description
This verification test consists of six elements, each associated with a different
material. For each of the first five materials, only one initiation criterion with its
corresponding evolution rule is specified; for the material assigned to the sixth element,
all five initiation criteria with their corresponding evolution rules are specified. In
this way the individual contribution to the overall damage variable (in the sixth element)
can be obtained explicitly from the damage variables of the first five elements.
Results and discussion
The overall damage variable matches with the total contributions from each of the
individual damage variables according to the specified combination rule; i.e., maximum or
multiplicative.
Hill, R., “On
Discontinuous Plastic States, with Special Reference to Localized Necking in
Thin Sheets,” Journal of the Mechanics and
Physics of
Solids, vol. 1, pp. 19–30, 1952.