Elements tested
QEC3D8 QEC3D8R
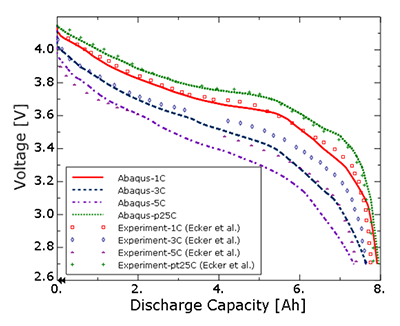
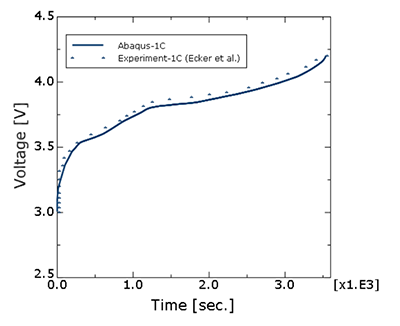
Products Abaqus/Standard Elements testedQEC3D8 QEC3D8R Features testedThis verification problem tests the thermal-electrochemical behavior of a lithium ion battery that involves the solution of lithium ion diffusion in the electrolyte and the electrodes, as well as the charge transfer process as captured by the 3D porous electrode theory Newman formulation. All associated thermal effects such as heat losses, temperature evolutions, and temperature-dependent properties are considered in the test cases. Problem descriptionThe problems test the discharge and charge analyses of a 7.5 Ah Kokam pouch cell as described in Ecker et al. (2015) (Part I) and Ecker et al. (2015) (Part II). Discharge analysis is performed at four different current (C) rates, while the charging analysis is done for 1C only, all at an ambient temperature of 25°C. In all cases, the discharge (or charge) curves predicted by the simulation are compared against the experimental results appearing in Ecker et al. (2015) (Part II). Model:The geometric and other relevant parameters, including individual electrode thicknesses, of the cell are as described in Ecker et al. (2015) (Part II). The total length, width, and thickness of the electrode stack are 0.101, 0.085, and 0.000147 meters, respectively. Mesh:The finite element model consists of 25 elements each of type QEC3D8 or QEC3D8R through the thickness for the active electrodes (anode and cathode) and 11 elements of the same type to represent the separator. Only one element is used in the plane because the setup is essentially one dimensional. The QEC3D8 and QEC3D8R elements support thermal-electrochemical degrees of freedom. Material:The anode material is graphite, and the cathode is made up of Li(Ni0.4Co0.6)O2, the thermal-electrochemical properties of which are described in Ecker et al. (2015) (Part I) and used in the models included in this section. An Arrhenius-type temperature dependence is used for several of the properties. Loading:The battery modeling is subjected to currents that correspond to a 1C charge analysis and various rates of discharge ranging from 0.25C to 5C. Results and discussionFigure 1 displays the discharge curves predicted by Abaqus showing the evolution of the voltage difference across the cell during discharge as a function of capacity for four different C rates (0.25C, 1C, 3C, and 5C) and compared with experimental results from Ecker et al. (2015) (Part II) for the same C rates. A reasonably good correlation is observed. Figure 2 shows the results from a charging simulation for 1C rate, which also compares well with the experimental values from Ecker et al. (2015) (Part II). The choice of swelling tables for the charge analysis with swelling resulted in voltage curves that are identical to the 1C rate charge voltage curve. Input files
References
Figures  | |||||||