Contour plots display the variation of a variable across the surface of a
model. You can create filled or shaded contour plots of field output results
from the output database.
From the main menu bar, select
PlotContoursOn
Deformed Shape.
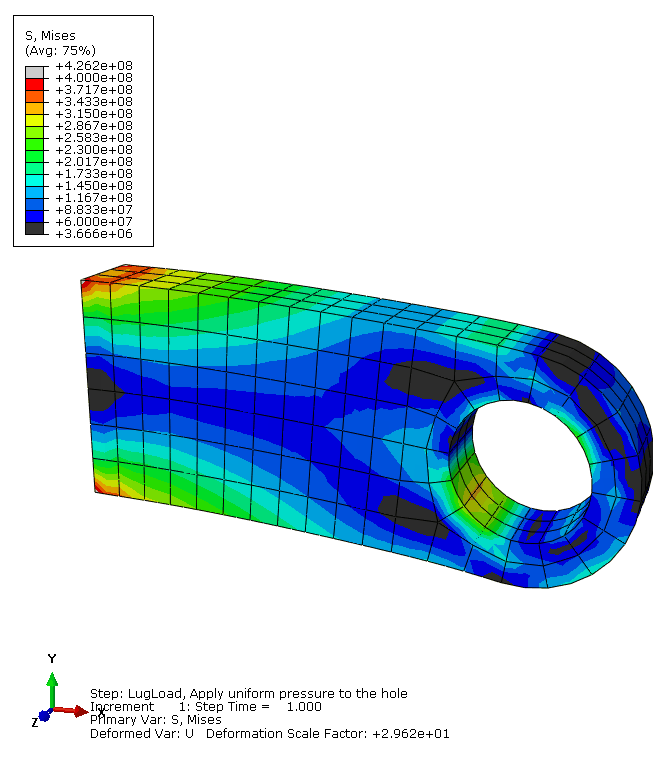
The filled contour plot shown in
Figure 1
appears.
The Mises stress, S Mises, indicated
in the legend title is the default variable chosen by
Abaqus
for this analysis. You can select a different variable to plot.
Figure 1. Filled contour plot of Mises stress.
From the main menu bar, select
ResultField
Output.
The Field Output dialog box appears; by default,
the Primary Variable tab is selected.
From the list of available output variables, select a new variable to
plot.
Tip:
You can also use the Field Output
toolbar, located above the viewport, to change the displayed field output
variable. For more information, see
Using the field output toolbar.
Click OK.
The contour plot in the current viewport changes to reflect your
selection.
Generate a customized contour plot
Context:
Abaqus/CAE
offers many options to customize contour plots. To see the available options,
click the Contour Options tool in the toolbox. By default,
Abaqus/CAE
automatically computes the minimum and maximum values shown in your contour
plots and evenly divides the range between these values into 12 intervals. You
can control the minimum and maximum values
Abaqus/CAE
displays (for example, to examine variations within a fixed set of bounds), as
well as the number of intervals.
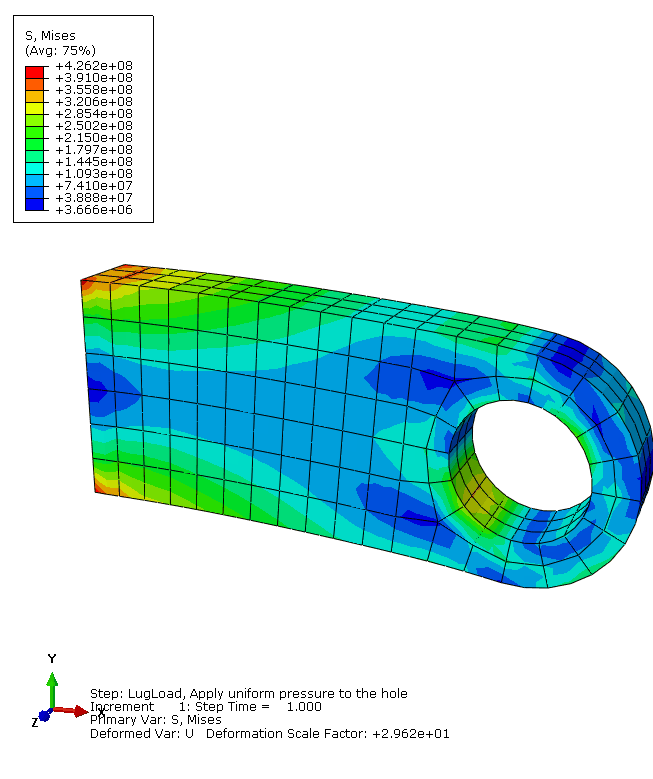
In the Basic tabbed page of the Contour
Plot Options dialog box, drag the Contour
Intervals slider to change the number of intervals to nine.
In the Limits tabbed page of the
Contour Plot Options dialog box, choose
Specify beside Max; then enter a
maximum value of 400E+6.
Choose Specify beside Min;
then enter a minimum value of 60E+6.
Click OK.
Abaqus/CAE
displays your model with the specified contour option settings, as shown in
Figure 2
(this figure shows Mises stress; your plot will show whichever output variable
you have chosen). These settings remain in effect for all subsequent contour
plots until you change them or reset them to their default values.
 tool in the toolbox. By default,