Customizing the symbols used on an X–Y curve | ||||
|
| |||
Context:
Use the Curve Options dialog box to customize the appearance of the symbols used to represent data points on an X–Y curve. For example, in Figure 1 the plot on the left uses the default symbols, while the plot on the right uses customized symbols.
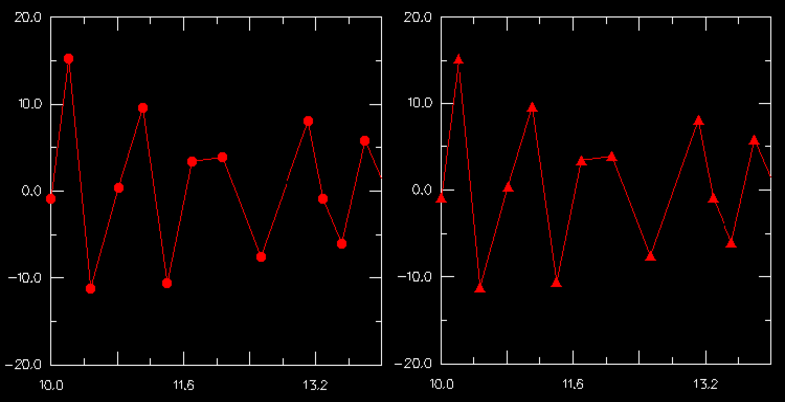
The symbol that you select appears along the curve and in the legend. The customization options are available only when Show symbol is toggled on.
-
Choose the symbol color:
-
Click the color sample
 .
.
Abaqus/CAE displays the Select Color dialog box.
- Use one of the methods in the Select Color dialog box to select a new color. For more information, see Customizing colors.
-
Click to close the Select
Color dialog box.
The color sample changes to the selected color. The new color does not appear in the viewport until you click or in the XY Plot Options dialog box.
-
Click the color sample