Customizing the appearance of an X–Y curve | ||||
|
| |||
Context:
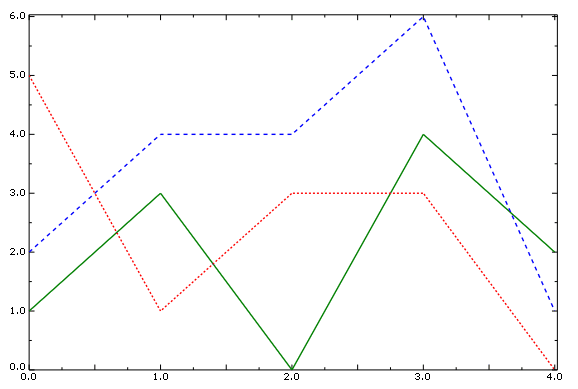
Use the Curve Options dialog box to customize the color, style, and thickness of the line used to represent an X–Y data object in an X–Y plot. Figure 1 illustrates some of the ways in which X–Y data curves can be customized.
The color, style, and thickness that you select appear along the curve and in the legend. The customization options are available only when Show is toggled on.
By default, Abaqus/CAE colors the X–Y curves in your plot by referring to the list of X–Y auto colors. You can modify this list from the Edit XY-Auto-Colors dialog box; see Editing the list of auto-colors for X–Y plots.
-
Choose the line color:
-
Click the color sample
 .
.
Abaqus/CAE displays the Select Color dialog box.
- Use one of the methods in the Select Color dialog box to select a new color. For more information, see Customizing colors.
-
Click to close the Select
Color dialog box.
The selected X–Y curve changes to the selected color.
-
Click the color sample