Controlling shell thickness display for postprocessing | ||||
|
| |||
Context:
For deformed and contour plots Abaqus/CAE scales the displacement components of the deformation but does not scale the rotational components of the deformation when you change the deformation scale factor. For contour plots Abaqus/CAE applies colors based on your selection of active section point locations. If the top section point or bottom section point is currently active, Abaqus/CAE displays the contour for that section point throughout the shell thickness; if both top and bottom section points are currently active, Abaqus/CAE creates a linear contour gradient from the top values to the bottom values through the shell thickness.
Displaying shell thickness after a sizing optimization allows you to view the resulting change in shell thickness across the design area of your structure as the optimization progresses.
Abaqus/CAE determines shell thickness for postprocessing using the shell thickness definition specified for the model in its undeformed state. If your model undergoes large deformations or large rotations during the analysis, shell thickness might not display well in the deformed plot state.
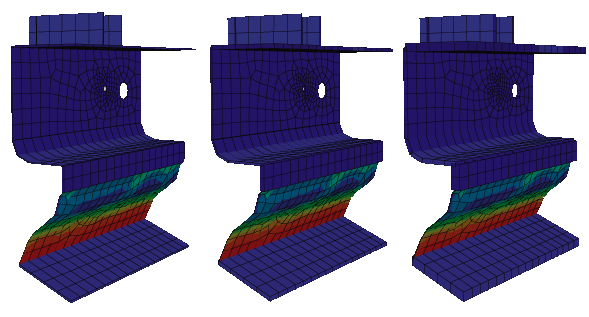
Displaying shell thickness enables you to examine the thickness of shell geometry relative to the rest of the model. You can apply a scale factor to reduce or increase the display of shell thickness for your session. Figure 1 shows the effect of scale factor changes to a model.

Abaqus/CAE renders shell thickness for three-dimensional shell elements only; thickness is not displayed for axisymmetric shell elements, such as SAX1 elements. When shell thickness is displayed, Abaqus/CAE also renders the edges of shell geometry unless a view cut is displayed in the viewport. Abaqus/CAE renders shell thickness according to the current settings for color coding and translucency. When these settings change, the color and translucency of the shell thickness change as well.