Choosing line-, banded-, quilt-, or isosurface-type contours

You can choose Line-, Banded-, or Isosurface-type contours to display the values of nodal (such as displacement) or element (such as stress) field output variables. Line-type contours represent values as customized colored lines on the surface of your model. Banded contours represent values as color-filled bands. Isosurface contours extend line-type contours through the model. Line, banded, and isosurface contours of element-based variable values are computed by extrapolating results to the nodes and conditionally averaging. Averaging depends on the characteristics of your model and on options you select. Line-type contours are not recommended for line-shaped elements, such as beams.

See Also
Understanding how contour values are computed
Stylizing line-type contours
Customizing banded- and isosurface-type contours

Context:

You can choose Quilt-type contours only for element field output variables. Variable values are extrapolated to element faces on the surface of your model, with no averaging between elements. Quilt contours are useful for evaluating results on an element-by-element basis. Only one color per element is plotted for axisymmetric elements with asymmetric deformation (CAXA or SAXA).

Banded-type contours are the default. You must choose line-, banded-, or isosurface-type contours to produce a plot of:

  • Nodal-based field output values.

  • Element-based field output values averaged across elements.

  • Element-based results discontinuities rather than field output values.

Figure 1 shows the appearance of line-, banded-, quilt-, and isosurface-type contour plots.
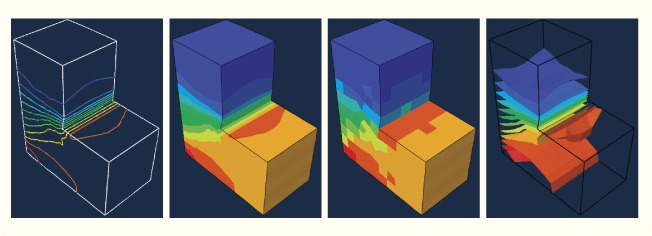
Figure 1. From left to right: line-, banded-, quilt-, and isosurface-type contours.

  1. Locate the Contour Type options.

    Select OptionsContour from the main menu bar or click in the toolbox; then click the Basic tab in the dialog box that appears. The Contour Type options are in the upper left corner of the page.

  2. Click Line, Banded, Quilt, or Isosurface to choose the contour type you want.
  3. Click Apply to implement your changes.

    The contour plot in the current viewport changes to display the contour type you have specified.

    By default, your changes are saved for the duration of the session and will affect all subsequent contour plots. If you want to retain your changes for subsequent sessions, save them to a file. For more information, see Saving customizations for use in subsequent sessions.