There are many examples of randomness associated with data. Particle sizes in a granular
media such as gravel are an example. Randomness observed in data can be described by
statistical distributions. Pseudo-random numbers that are generated based on statistical
distributions are used to capture randomness in data in a numerical simulation.
Applications
The size distribution of particle species generated by a particle generator can be
described by statistical distributions.
Probability Density Function
A probability density function (PDF) describes the
probability of the value of a continuous random variable falling within a range. If the
random variable can only have specific values (like throwing dice), a probability mass
function (PMF) would be used to describe the probabilities
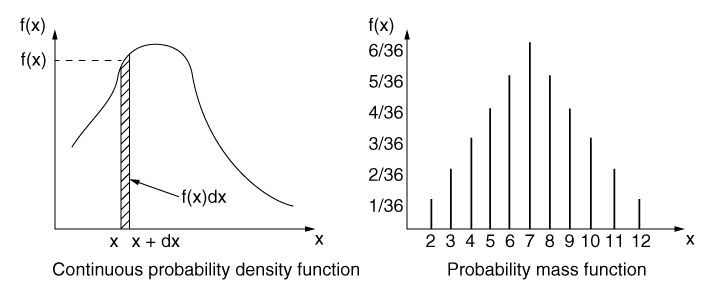
of the outcomes. The plot on the left in Figure 1 shows a
PDF for the random variable . The probability that the random variable has a value in the range and is . The probability that the random variable will be in the range is given by:
The probability that the random variable is in the range and is one; i.e.,
The area under the PDF curve is, therefore, always unity.
Figure 1. Probability distributions of continuous and discrete variables.
The plot on the right in Figure 1 shows a
PMF where the horizontal axis shows the specific values
of the random variable and the vertical axis shows the corresponding probabilities.
Abaqus/Explicit supports uniform, normal (Gaussian), log-normal, piecewise linear, and discrete
probability density functions. To define a probability density function, you must assign it
a name and specify its type.
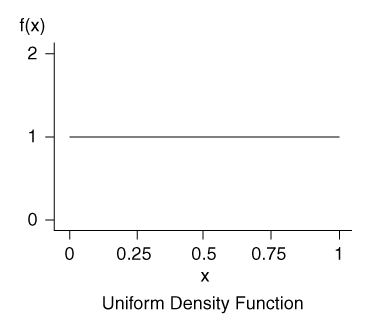
Uniform distributions (shown in Figure 2) have many applications, particularly in the numerical simulation of random processes.
The following function describes a uniform probability density function for a random
variable between and :
The mean is and the variance is . You specify and for the uniform distribution.
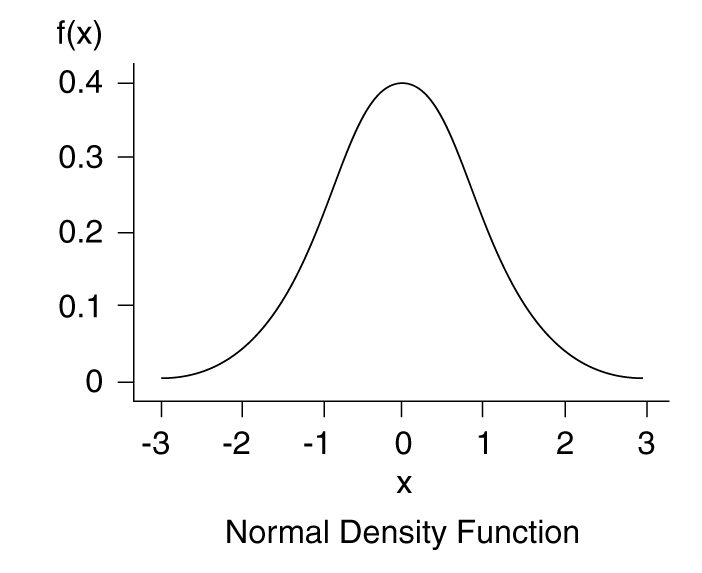
Normal distributions (shown in Figure 3) have many applications in science and engineering; for example, errors in experimental
measurements are often assumed to have a normal distribution. The following function
describes a normal probability density function:
The mean is , and the variance is . You specify the mean, , and standard deviation, , for the normal distribution.
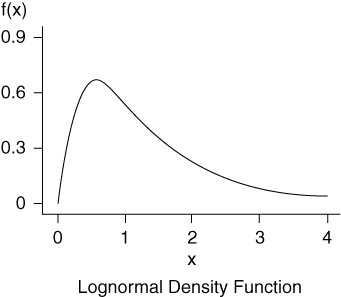
Log-normal distributions (shown in Figure 4) are used in describing many natural phenomena. They are commonly used to describe
particle size distributions in soils. The following function describes a log-normal
probability density function:
The mean, , and standard deviation, , in the space are related to and as follows:
where the parameters and are the mean and standard deviation in the space; given by and respectively. You specify the mean, , and the standard deviation, , in the space for the log-normal distribution.
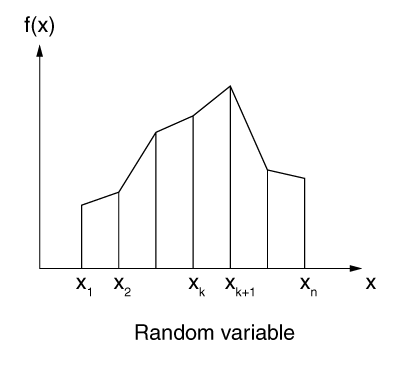
A piecewise linear probability density function can be used to approximate general
distributions that are not well represented by the other
PDF forms discussed above. With a piecewise linear
probability density function, you specify PDF values at
discrete points. Abaqus/Explicit considers linear variations in the PDF between these
points, as shown in Figure 5. The PDF is zero below the first data point and above
the last data point.
Figure 5. Piecewise linear PDF.
As mentioned earlier, the area under a PDF is unity.
When the deviation of the area under the PDF is within 2%
of unity, Abaqus/Explicit renormalizes the specified PDF data to achieve this
requirement. This renormalization of data values allows you to specify relative
PDF values that can be obtained from a histogram with
small numerical errors. A histogram contains the data in the form of a table of random
variable ranges and the percentage or number that falls within those ranges. The
PDF is obtained from the histogram by normalizing the
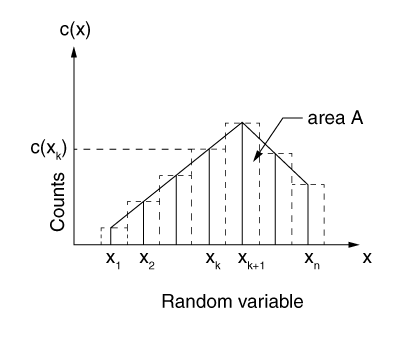
area under the histogram. As shown in Figure 6, you specify a table of the midpoint value of each range in the normalized histogram
and the corresponding count:
Figure 6. Histogram.
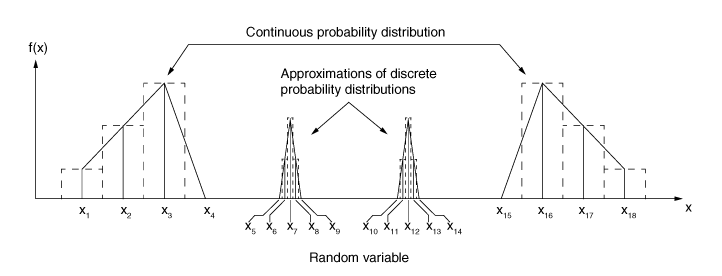
There may be situations where the random variable has continuous values over certain
ranges and discrete values elsewhere. Figure 7 shows the use of a piecewise linear probability density function to approximate such
distributions where the discrete values are approximated by continuous random variables
spanning a very narrow range of values (for example, the discrete value is approximated by the continuous range from to ).
Figure 7. Approximating a discrete probability distribution using a piecewise linear
PDF.
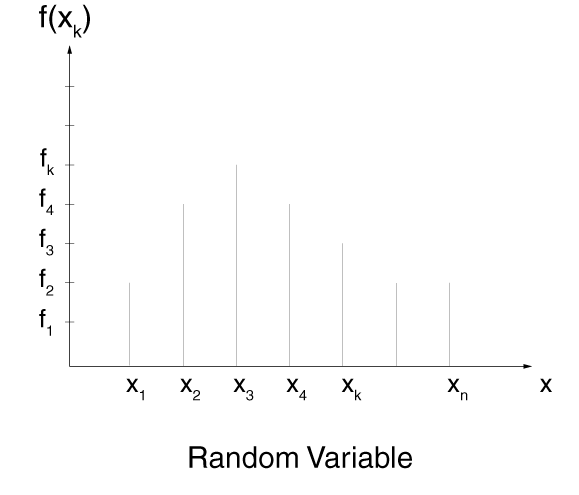
Some applications have only certain specific outcomes. These applications can be
represented by a discrete probability density function, as shown in Figure 8. A simple example is throwing of a pair of dice. Only the outcomes of 2, 3, 4, 5, 6, 7,
8, 9, 10, 11, and 12 are possible, with the probabilities of 1/36, 2/36, 3/36, 4/36, 5/36,
6/36, 5/36, 4/36, 3/36, 2/36, and 1/36, respectively. A very specific case of a discrete
probability density function is the case when only one value occurs with the probability
of 1. To specify a discrete probability density function, you provide a table of the
specific values of the random variable along with the corresponding probability:
The specified probabilities should sum up to 1. Small deviations can occur in some cases.
When the sum of the probabilities is within two percent of unity, Abaqus/Explicit renormalizes the specified probabilities to ensure that they sum up to 1.
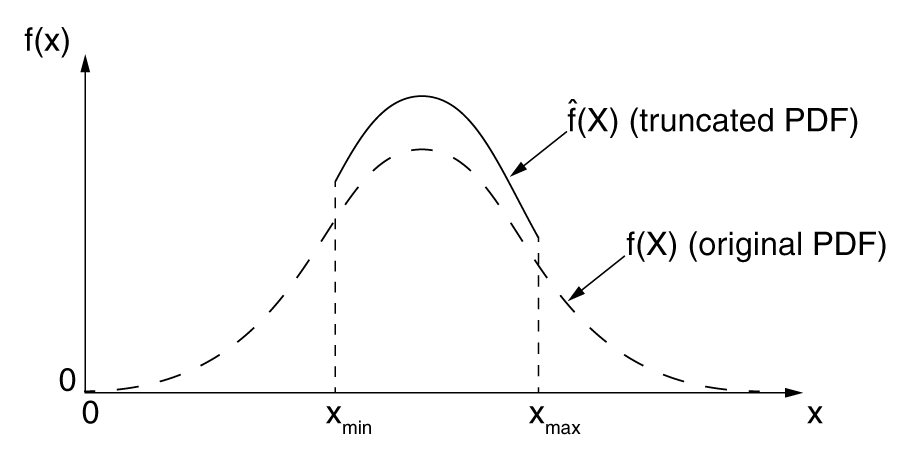
The normal and log-normal probability density functions have open-ended characteristics.
These PDFs can be truncated to enforce upper and lower
bounds on the value of the random variable. Figure 9
shows a truncated normal distribution where all values of the random variable and from the untruncated normal distribution have been rejected.
where
The factor represents the probability that the random variable is in the range from to for the untruncated PDF.
Figure 9. Truncated PDF.
You specify the lower and upper limits of the random variable along with the mean and
standard deviation for these types of PDFs. The uniform and
the piecewise linear distributions have lower and upper limits for the random variable built
into the definition of the PDF and, therefore, do not
require renormalization because of truncation.
Output
No output is available for probability density functions.
Limitations
Probability density functions are supported only for the size distributions of
PD3D elements created using a particle
generator.
Input File Template
The following example illustrates the use of a
probability density function for particle size
distribution:
Benjamin, J.R., and C. A. Cornell, “Probability,
Statistics, and Decision for Civil
Engineers,” McGraw-Hill, 1970.
Press, W.H., S. A. Teukolsky, W. T. Vetterling, and B. P. Flannery, “Numerical
Recipes in Fortran 77, The Art of Scientific
Computing,” University of
Cambridge, 1992.
Saucier, R., “Computer
Generation of Statistical
Distributions,” Army Research
Laboratory, 2000.