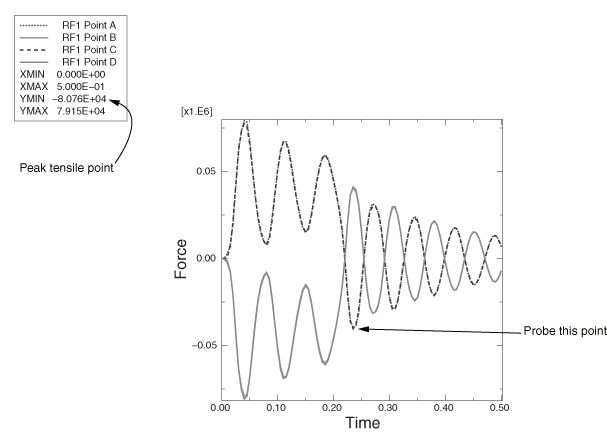
Plot multiple curves
-
In the
Results Tree,
click mouse button 3 on History Output for the output
database named
DynCrane.odb. From the menu that appears, select Filter. -
In the filter field, enter
*RF1*to restrict the history output to just the reaction force components in the 1-direction. -
From the list of available history output, select the four curves
(using
CtrlClick)
that have the following form:
Reaction Force: RF1 PI: TRUSS-1 Node xxx in NSET ATTACH -
Click mouse button 3, and select Plot from the
menu that appears.
Abaqus/CAE displays the selected curves.
-
Click
 in the prompt area to cancel the current procedure.
 in the Visualization toolbox
to open the