Using the debugger | ||
| ||
To open the debugger, select
or click Start debugger
 . If you have a script paused in the main window, the debugger opens
at the current position of the test. If you do not have a paused script, the
debugger automatically begins running the main file and positions the cursor at
the start of the script.
. If you have a script paused in the main window, the debugger opens
at the current position of the test. If you do not have a paused script, the
debugger automatically begins running the main file and positions the cursor at
the start of the script.
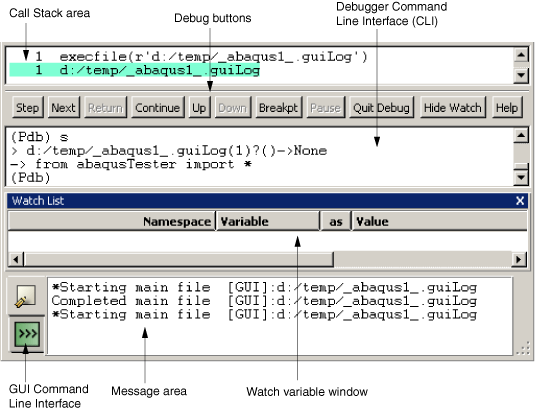
The debugger consists of a call stack area, action buttons, and the debugger command line interface (CLI) window, as shown in Figure 1. The debugger is positioned between the Abaqus PDE main window and the message area.
The debugger uses a custom Python module named atxPdb, based on the Python pdb module. You can enter Pdb commands in the debugger CLI; you can also enter any Python statements in the debugger CLI. Python statements are executed in the same process—GUI, kernel, or local—that is running the current script (for more information, see Running a script).
If you enter a command in the debugger CLI and it does not seem to work, it may be conflicting with a Pdb command.
The debugger contains a tool to watch variables as scripts are executed. To add a variable to the watch list, click mouse button 3 over the variable name in the Abaqus PDE main window and select Add Watch: variable name from the menu that appears. The Abaqus PDE adds the variable to the watch list, indicating the namespace that the variable is defined within, the variable name, the type of data the variable can store, the current value, and the file and line where the variable is located. When you execute or step through the script, the variable information is updated as needed. You can also activate the watch list tool after starting the debugger by selecting from the action buttons below the call stack area or by selecting . Abaqus displays the Watch List area below the debugger or below the main window if the debugger is not open.
You can also customize the following aspects of variable display in the Watch List:
-
You can switch a variable's display format between repr and str formats. The repr() function returns a string that is better suited to being read by the Python interpreter, while the str() function returns a string better suited to printing. For more information about the built-in Python functions repr() and str(), refer to the official Python website (http://www.python.org).
To toggle between these settings, click mouse button 3 on a watch variable row and select Display repr (not str) value of variable name or Display str (not repr) value of variable name from the list that appears. If the variable is a local variable and the program is not accessing that section of code, the variable value will be set to “not evaluated.” Variable values are also set to “not evaluated” if the program is not running.
-
You can prompt the Abaqus PDE to pause when the program reaches a line in which the value of a selected watch variable has changed. To toggle on the “stop on change” option for a particular watch variable, click mouse button 3 on the variable's line and select Stop on change to variable name from the list that appears. When this option is selected, Abaqus PDE stops at the line after the change.
-
You can remove any watch variables from the debugger by clicking mouse button 3 on the variable's line and selecting Delete watch var variable name from the list that appears.