Defining model feature edges | |||||
|
| ||||
Context:
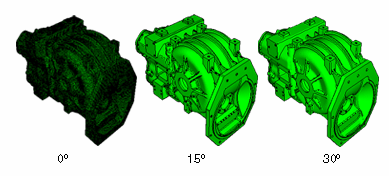
In Figure 1 the plot on the left shows feature edges when the feature angle is set to 0°, the plot in the middle shows feature edges on the same model but with the feature angle set to 15°, and the plot on the right shows the model with the feature angle set to 30°.
