The module Tosca Structure.report
allows a preparation of the optimization results for post-processing by
Tosca Structure.view
(see more Generation of Post-Processing Data). The user can navigate
through the several steps of the iterations to visualize the changes
in the model for one or more optimization relevant values. Further, graphs
of specific optimization terms like, for example, values of the objective or
constraints, can be added to the vtfx visualization archive. Tosca Structure.view
provides you with a plug-in for MS PowerPoint to create interactive presentations
including your optimization results (see more VTFX Plug-In for Office Applications).
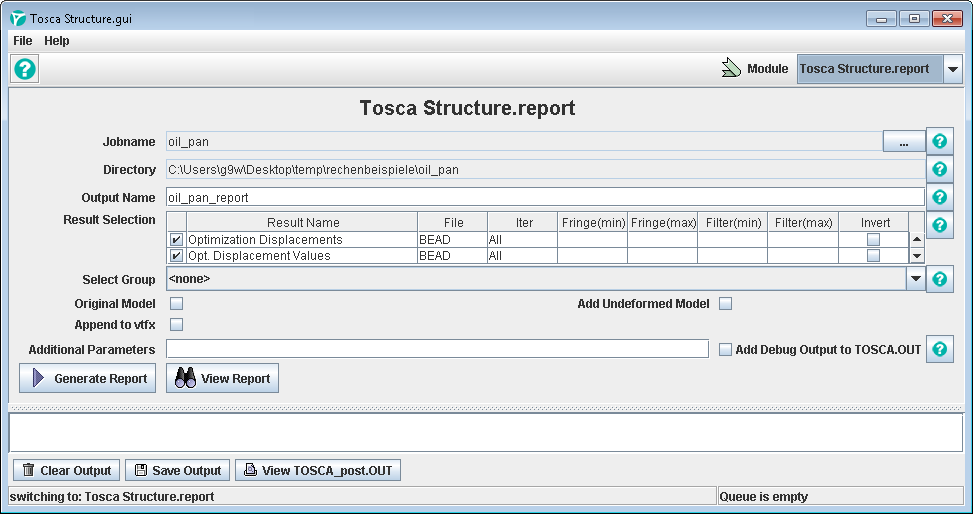
The following figure shows the preparation of the optimization results for
FE post-processing in Tosca Structure.report: