About the WebDashboard Interface | ||
| ||
When you log in to the WebDashboard, a summary screen is displayed.
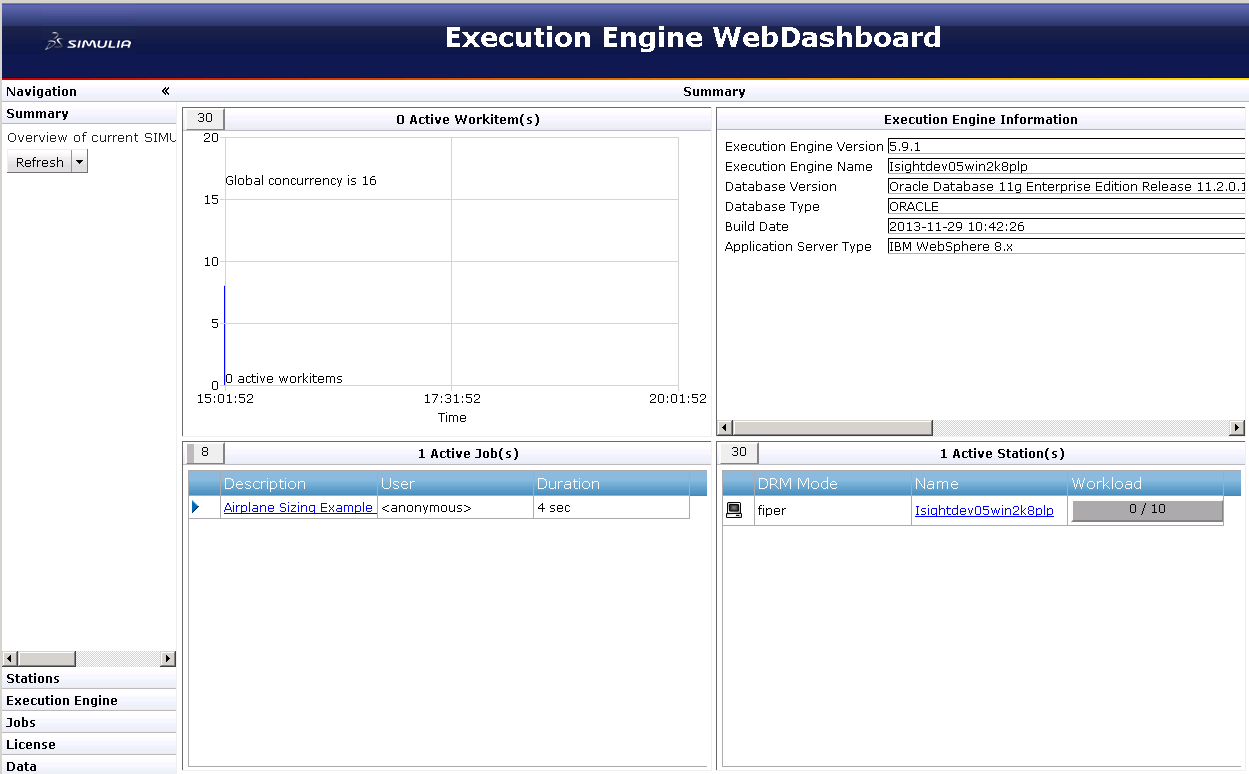
This screen provides an overview of the SIMULIA Execution Engine status including the following information:
-
Active Workitems graph. Shows two workitems-related graphs on a single pair of axes:
-
The blue line is a graph of the total number of workitems dispatched to all attached stations plotted against time.
-
The red line is a graph of the total number of workitems that can be processed concurrently by all attached stations plotted against time. This number is calculated by adding up the concurrency settings for each of the running stations attached to the SIMULIA Execution Engine.
This is historical data starting at the time the WebDashboard was launched (or the browser window was last refreshed), up to a maximum of five hours. It is periodically updated with the latest information from the SIMULIA Execution Engine.
Note: This feature is available only if you have administrative privileges. -
SIMULIA Execution Engine Information table. Shows information such as the name of the SIMULIA Execution Engine, the type of database used, and the application server used by the SIMULIA Execution Engine (WebSphere or WebLogic). You can get more specific information as described in Viewing Details for the SIMULIA Execution Engine.
-
Active Jobs table. Shows the status of the jobs currently being executed (if any), the name of the jobs currently being executed, the user executing the jobs, and how long the jobs have been running. To see additional job information and control the execution of current jobs, see Working with Running Jobs.
Note: This feature is available only if you have administrative privileges. -
Active Stations table. Shows the stations currently connected to the SIMULIA Execution Engine (in either the active and shutdown state), the DRM mode, and the current workload for each station. You can access additional station information by clicking the link that corresponds to the station name. For more information on the options that appear when this link is clicked, as well as how to view more station information, see Viewing Station Information.