Elements tested
QEC3D8 QEC3D6 QEC3D4
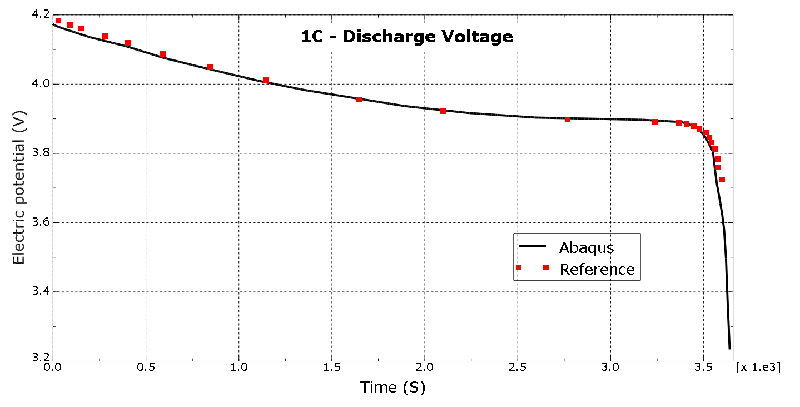
Products Abaqus/Standard Elements testedQEC3D8 QEC3D6 QEC3D4 Features testedThis verification problem tests the thermal-electrochemical behavior of a solid electrolyte battery modeled using a lithium metal anode and a solid cathode. The lithium ion battery involves the solution of lithium ion diffusion in the separator, as well as the charge transfer process at the interfaces of the anode-separator and cathode-separator. The interaction of the solid electrodes with the separator is modeled using a Butler-Volmer surface interaction load. Concentration of lithium in the cathode is modeled using diffusion process. Problem descriptionThe problem tests the lithium metal battery cell charging capabilities at different charge rates, as described in Tian et al. The results compare very well with that shown in Tian et al. Model:The geometric and other relevant parameters, including individual electrode thicknesses, of the cell are as described in Tian et al. The different electrodes are in nanometer lengths. The separator is 1500 nm long, and the cathode is 1820 nm long. Mesh:The finite element model consists of 3 elements each of type QEC3D8 or QEC3D6 or QEC3D4. The solid anode is modeled with one element through the thickness. The cathode and separator elements are modeled with one element each, respectively. Only one element is used in the plane because the setup is essentially 1D. The QEC3D8, QEC3D6, and QEC3D4 elements support thermal-electrochemical degrees of freedom. Material:The anode material is solid lithium, and the cathode is made up of lithium cobalt oxide. The thermal-electrochemical properties of the different regions described in Tian et al are used in the models included in this section. Loading:The battery is subjected to a current load that corresponds to a 1C discharge analysis. Results and discussionFigure 1 displays the discharge curves predicted by Abaqus, showing the evolution of the voltage difference across the cell during charge as a function of time for 1C rate and the simulation results from for the same C rate. A reasonably good correlation is observed. Input files
Input files to model a half-cell lithium battery with *MULTIPHYSICS LOAD
References
Figures | |||||||