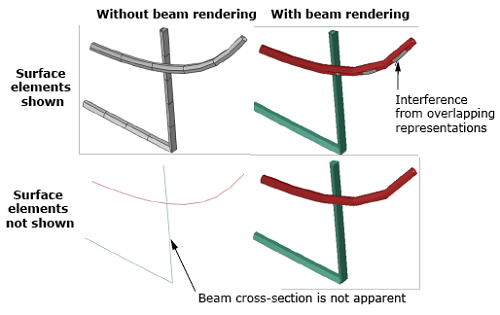
Figure 3 shows four options for representing the beam geometry in the vicinity of contact
for this simulation:
-
The surface-element representation shown in the upper-left corner of Figure 3 will likely appear by default for most postprocessors. Postprocessors
typically do not render beam element profiles by default but will represent
the automatically generated surface elements by default.
-
The upper-right corner of Figure 3 has beam element rendering active during postprocessing, and the
surface-element representation remains active in the display group. In this
case, some interference occurs between the two types of representations,
with the rendered beam representation primarily showing through.
-
The bottom-right corner of Figure 3 has beam element rendering active during postprocessing, with surface
elements removed from the display group. In this case, only the beam element
rendering appears.
-
The bottom-left corner of Figure 3 has beam element rendering inactive and surface elements removed from the
display group. In this case, only references lines of the beam elements are
displayed the beam cross-section is not apparent in this view.
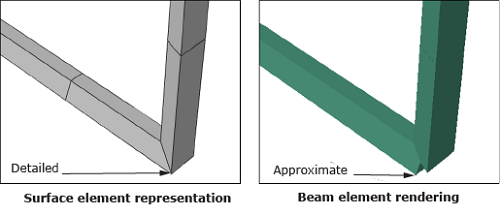
The first and third options listed above are best for viewing the beam
configurations. Figure 4 compares the surface element representation (first option) and the beam element
rendering (third option) near the corner of the L-shaped beam. The surface element
representation provides more detail at the corners, whereas the beam element
rendering is approximate. Surface element representations are less detailed at
junctions of three or more beam elements.
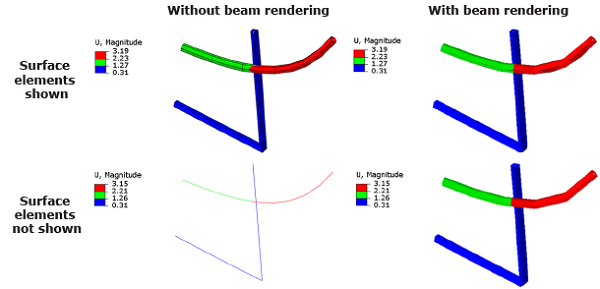
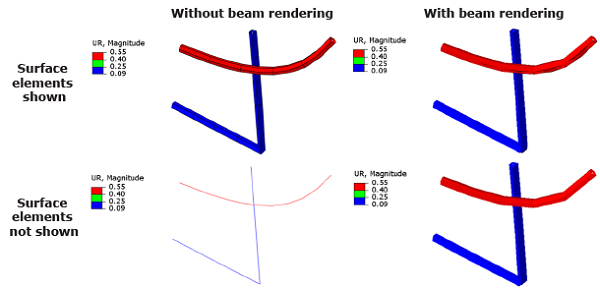
Figure 5 and Figure 6 show contour plots of the displacement magnitude and rotation magnitude,
respectively, for the same four options of representing beams as discussed above.
Three of these options provide similar plots, but the bottom-left plots in the
respective figures do not show the beam cross-section. The maximum displacement
magnitude in Figure 6 is greater in the top two plots with surface elements in the display group. These
plots consider displacement values for nodes on the exterior surface of the beam,
which can be larger than displacements along the reference line of the beam, due to
rotational effects.
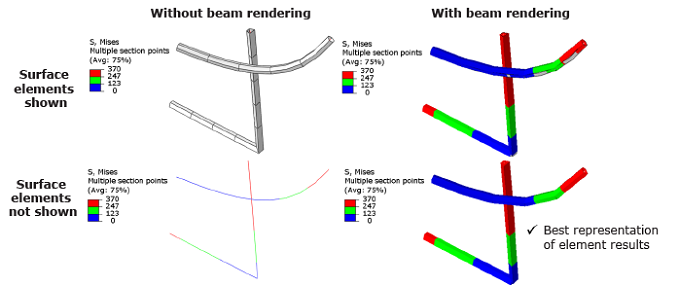
Figure 7 shows Mises stress contour plots for the same four options of representing beams.
Element results associated with beam elements are not known to surface elements;
therefore, the Mises results are not apparent in the upper-left corner of Figure 7 associated with surface elements. Stress, strain, and other elements results
fundamentally associated with beam elements should be viewed on a beam element
representation.
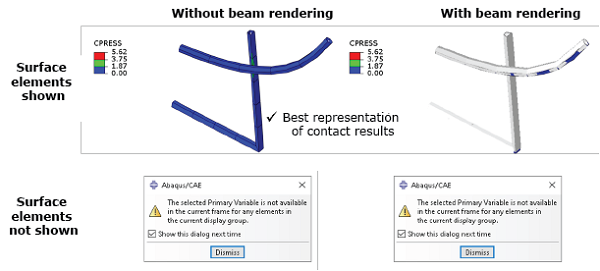
Figure 8 shows contact pressure contour plots for the same four options of representing
beams. Contact results for this simulation are best viewed on the surface element
representation without beam element rendering (top-left plot of Figure 8). Beam element rendering in the top-right plot mostly obscures
CPRESS plotted on the surface
elements in the top-right of Figure 8. The two bottom cases in Figure 8 without surface elements in the display group lead to diagnostic messages
regarding the selected variable not being available for any elements in the current
display group.
