About Error Analysis | ||
| ||
The total error is calculated for each response using one of four different approaches (average error, maximum error, root mean square error, R2).
The total error is presented visually for each response using four different graph types:
-
Actual versus predicted fit
-
Residual scatter
-
Residual frequency
-
Total Error bar chart
The error is calculated based on a number of sample points specifically allocated for error analysis. These points are defined when you create the approximation (see Creating Approximations).
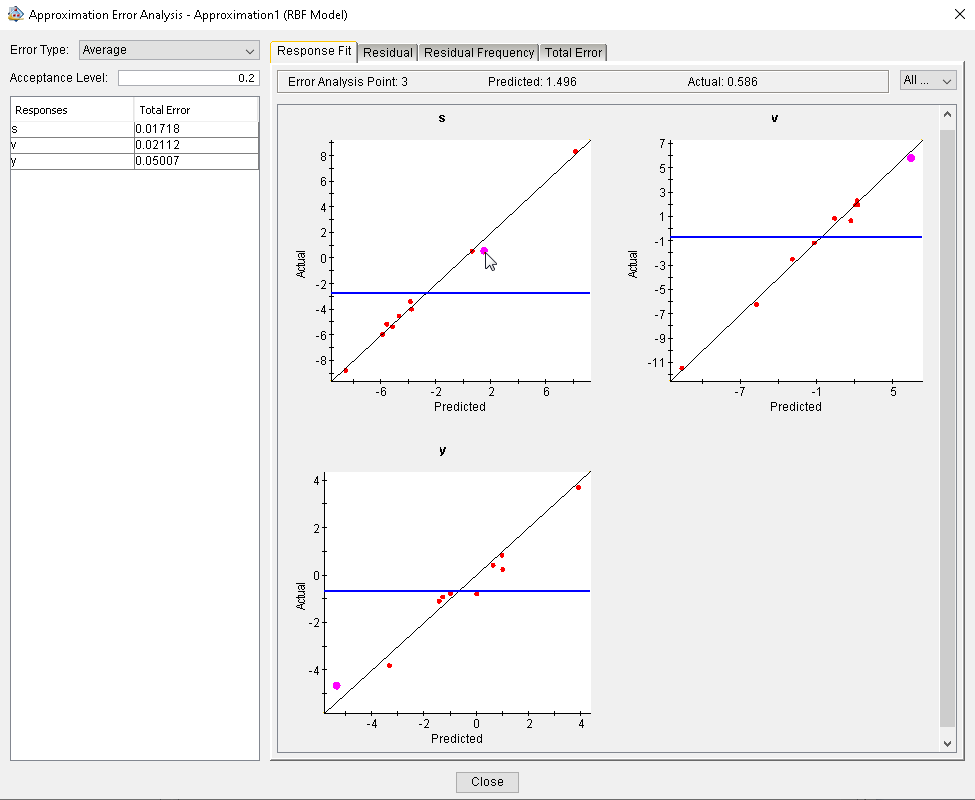
You use the Design Gateway’s Approximation Error Analysis dialog box or the Runtime Gateway’s Error Analysis subtab to view the approximation errors. Isight displays the following information:
-
A table of error values for each output parameter, with a list of error types, and a text box for setting the acceptable level of error for the error type. Outputs with errors exceeding the acceptable level are highlighted in red.
- A tabbed notebook panel with a graphical representation of error information for one or more output parameters (responses).
- If you hover over any point in the graph displayed under the Response Fit panel, the Error Analysis Point number, the Predicted value, and the Actual value will be displayed for that point just below the tabbed notebook panel.
- If you hover over any point in the graph displayed under the Residual
panel, the Error Analysis Point number, the Actual
value, and the Residual value will be displayed for that point just below
the tabbed notebook panel.
The figure below shows an example of the Design Gateway’s Approximation Error Analysis dialog box:
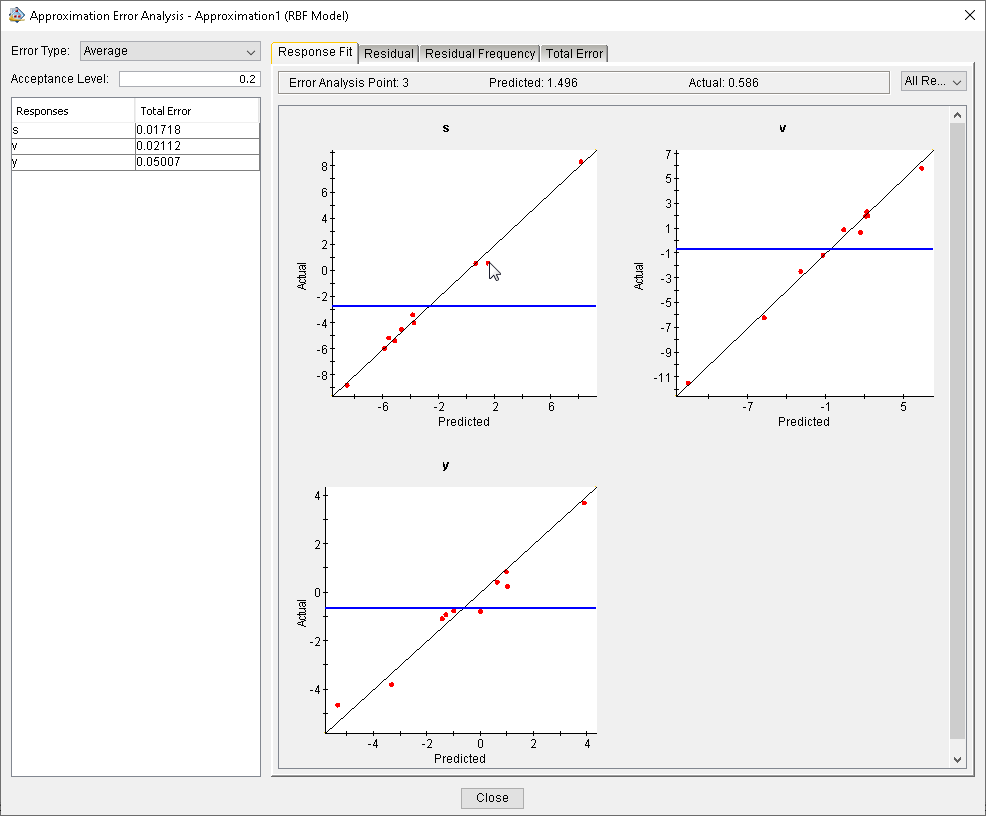
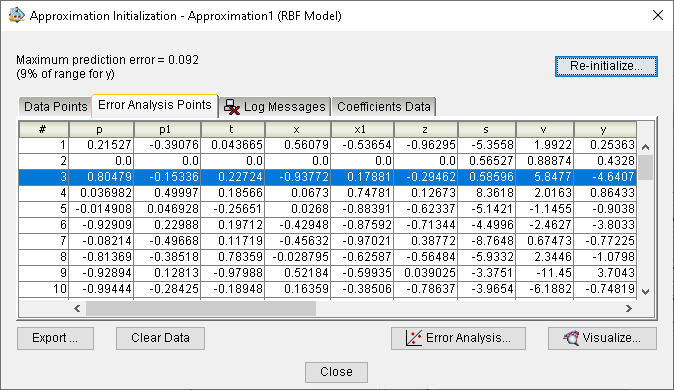
- If you click on any point in the graph displayed under the Response Fit
or Residual panel, the corresponding Error Analysis
Point will be highlighted in magenta color on every graph for all responses under
both panels. In addition, the corresponding row will be highlighted in the table displayed under
the Error Analysis Points tab.
The figures below show an example.