Visualize Shape Optimization Results | ||
| ||
There are three variants of shape optimization results saved in
VTFX
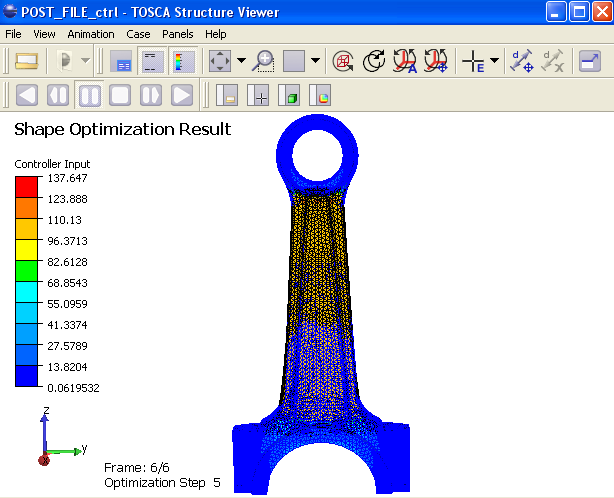
file that are accessible:- Optimized geometry with the fringe plot of controller input values (items under when TYPE_PROPERTY = NODAL CONTINUOUS (SHAPE) selected at CONTOUR_PLOT);
- Optimized geometry with the fringe plot of displacements (items under when TYPE_PROPERTY = NODAL DISPLACEMENT (SHAPE) selected at CONTOUR_PLOT);
- Geometry with test displacements and the fringe plot of displacements (items under TEST_SHAPE_CHECK in CHECK_INPUTS).
See Changing Settings of the Fringe Plot to control the appearance of the fringe plot.