Viewing the History of a Component Run | ||
| ||
-
Select the
History
tab.
In the following example the ApproxLoop component from the ApproxLoop-AirplaneSizing example is displayed:
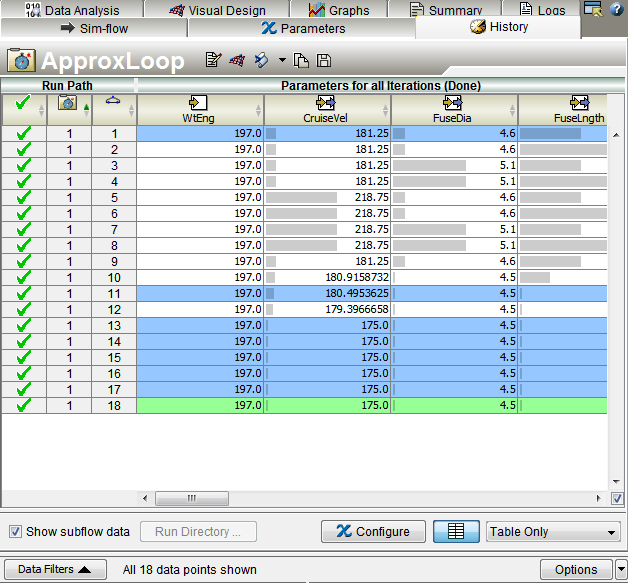
The first column indicates the status of the run using the following symbols:

The run was successful.

The run was not successful.

An approximation was executed instead of the actual component.

Data were replaced by data from the database using either Database Lookup or Job Rerun. This symbol appears in the column beneath the icon indicating a successful or unsuccessful run. By default, the Database Lookup feature is disabled (see Setting Local Database Options ).
The next columns (before the parameter values) show the run for each component. The components are shown in relation to one another. The root is always run once. If process components are nested, the run numbers for components in the subflow of the lower-level process components cycle from 1 to N numerous times.
- Optional:
Click
 at the
bottom of the tab to toggle off and on the run grading and minimum/maximum bars.
The bars indicate the magnitude of the cell's value relative to the range of all
values in the column.
at the
bottom of the tab to toggle off and on the run grading and minimum/maximum bars.
The bars indicate the magnitude of the cell's value relative to the range of all
values in the column.
The range is defined by the lower and upper bound of the parameter as specified in the problem formulation in design gateway. The output parameters may, however, violate the lower and upper bounds. For such scenarios, the bars are set to minimum magnitude (for lower bound violations) or maximum magnitude (for upper bound violations).
By default, the minimum/maximum bars appear. To turn off the preference, see Setting Execution Preferences. For information about run grading, see Understanding Run Grading.