For factor level combinations
that have not yet been executed, the Taguchi Main Effects Viewer presents
an estimate of the S/N ratio and sensitivity and offers a means of executing
a set of confirmation runs in Isight
to obtain actual values for the metrics.
For dynamic-standardized systems, the S/N ratio and the three polynomial
expansion coefficients (Beta 1, Beta 2, and Beta 3) are included in the
Taguchi Main Effects Viewer.
The following figure shows an example of the Taguchi Main Effects
Viewer:
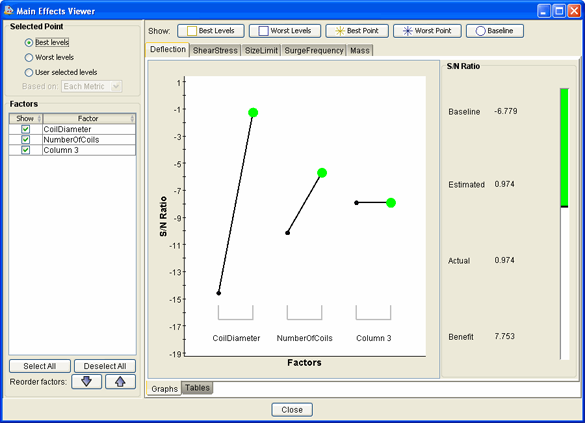
The center panel of the Main Effects Viewer
contains tabs along the top for each response, and each response tab
contains a Graphs and Tables
subtab that displays the Taguchi Main Effects graphs and tables corresponding
to the currently selected point. The S/N Ratio area on the
right side of the Main Effects Viewer displays
metrics that correspond to the currently selected point (set of factor
levels).
For information on selecting factors, see Changing the Factors Used in the Taguchi Main Effects Viewer Graphs and Tables.
Taguchi Main Effects Viewer Graphs
You can use the Taguchi Main Effects Viewer to view graphs of the Taguchi
response metric values for the various significant factor level combinations
for each response. By default, Isight
displays a Signal-to-Noise (S/N) Ratio graph.
Depending on the system type, Isight
also displays the following graphs:
| System Type |
Graphs Displayed |
| Static |
Sensitivity graph for all nominal-is-best type
responses |
| Dynamic |
Sensitivity graph |
| Dynamic-Standardized |
A graph for each of the three polynomial expansion
coefficients (Beta 1, Beta 2, and Beta 3) |
The graphs show the values for the Taguchi response metrics at each
level of the factors. The graphs display the currently selected point,
and you can overlay various symbols to indicate other points of interest
(see Displaying Factor Level Sets Relative to Response Metrics).
Note:
For a more detailed description of the S/N ratios,
sensitivity, and the dynamic-standardized polynomial expansion coefficient,
as they relate to the Taguchi robust design process, see About the Taguchi Robust Design Analysis Types in the Isight Component Guide.
Taguchi Main Effects Viewer Tables
You can use the Taguchi Main Effects Viewer to view tables of the Taguchi
response metric values for the various significant factor level combinations
for each response.
Each response metric table has the same structure, with columns for
the primary significant sets of factor levels:
The following figure shows an example of a Taguchi Main Effects Viewer
table:
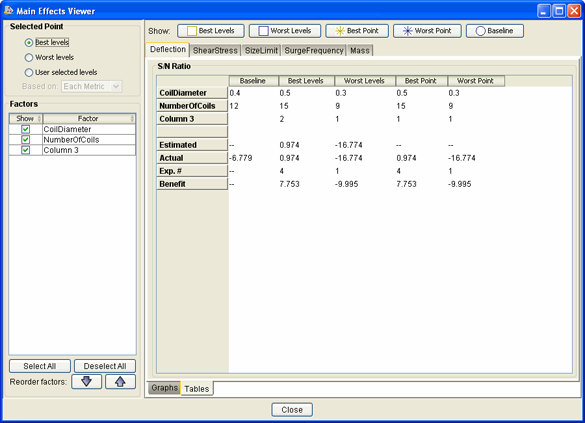
A row is provided for each factor to specify its values for the corresponding
sets of levels, and the Estimated and Actual
metric values are provided for each set of levels along with the Benefit
determined relative to the Baseline. For sets
of levels that correspond to an actual experiment number (as defined
in the Taguchi component) that was executed, the experiment number is
also listed. You can change the factors shown in the tables (see Changing the Factors Used in the Taguchi Main Effects Viewer Graphs and Tables).
Taguchi Main Effect Viewer S/N Ratio Metrics
The Taguchi Main Effects Viewer shows the metric values for the currently
selected combination of factor levels.
The following metric values are displayed:
| Baseline | If a baseline
design is included in the Taguchi Robust Design component execution,
Isight
displays the values for the Taguchi response metrics at that baseline
design on the right side of the Main Effects Viewer. |
| Estimated | This value
represents the estimated value of the Taguchi response metric at the
selected point (it is estimated because, in many cases, this combination
of factor levels was not actually executed). |
| Actual | This value represents the actual value
of the Taguchi response metric at the selected point, provided that the
combination of factor levels was executed. If the combination of factor
levels has not yet been executed, the  button appears, which will execute a set of confirmation
runs for this combination of factor levels to determine the Taguchi response
metric values. button appears, which will execute a set of confirmation
runs for this combination of factor levels to determine the Taguchi response
metric values. |
| Benefit | This value represents
the amount of improvement (in terms of Taguchi response metric values)
that is achieved at the selected point relative to the baseline design.
If the Actual value is provided, the benefit is
calculated as Actual-Baseline. If no Actual value
is available, the benefit is calculated as Estimated-Baseline. Note:
If no baseline design is available, the benefit
is not calculated.
|
If a baseline design is provided (so that a benefit can be calculated),
Isight
also displays a benefit meter on the right side of the Main
Effects Viewer for each Taguchi response metric. The black
line in the meter indicates the value for the baseline design, and it
is positioned within the meter based on the total known range of values
for the response metric (determined by the higher of the best point or
best levels design and the lower of the worst point or worst levels design).
The meter is colored in to indicate the value of the response metric
relative to the baseline, with green indicating a positive benefit and
red indicating a negative benefit (or deficit). As you select different
points, you can watch the meter change, giving you a graphical representation
of the benefit without needing to focus on the specific numbers.